bayesProtQuant
Table of Contents
Introduction
Also here is a link to a page page2
Project description
Tools
Project Log
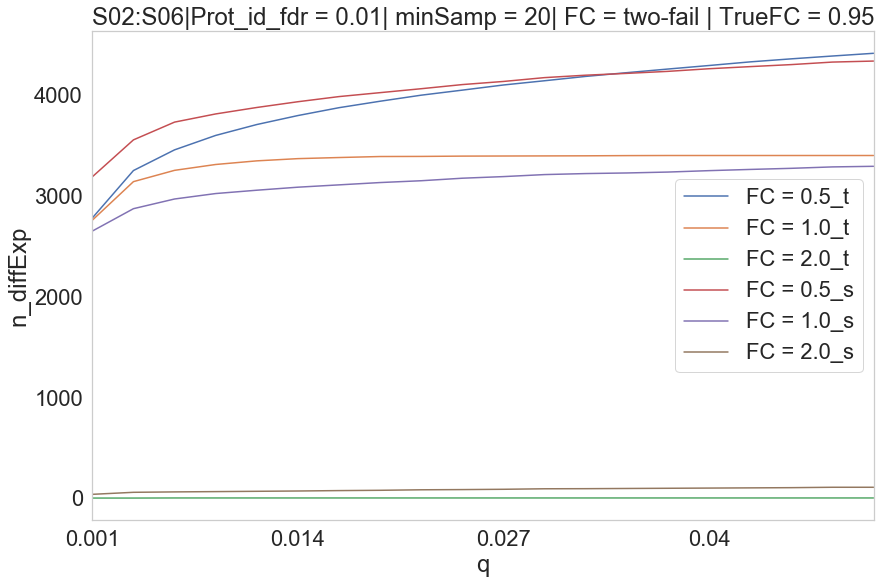
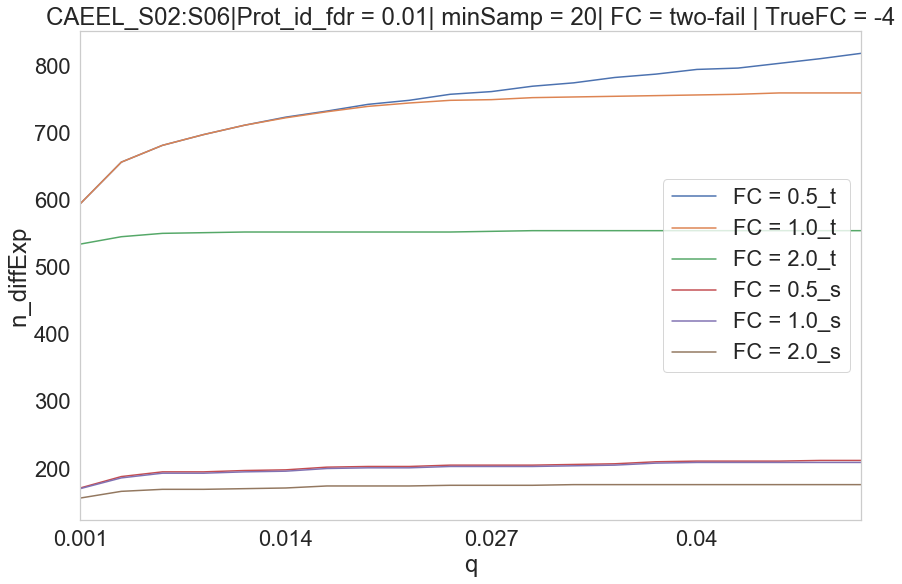
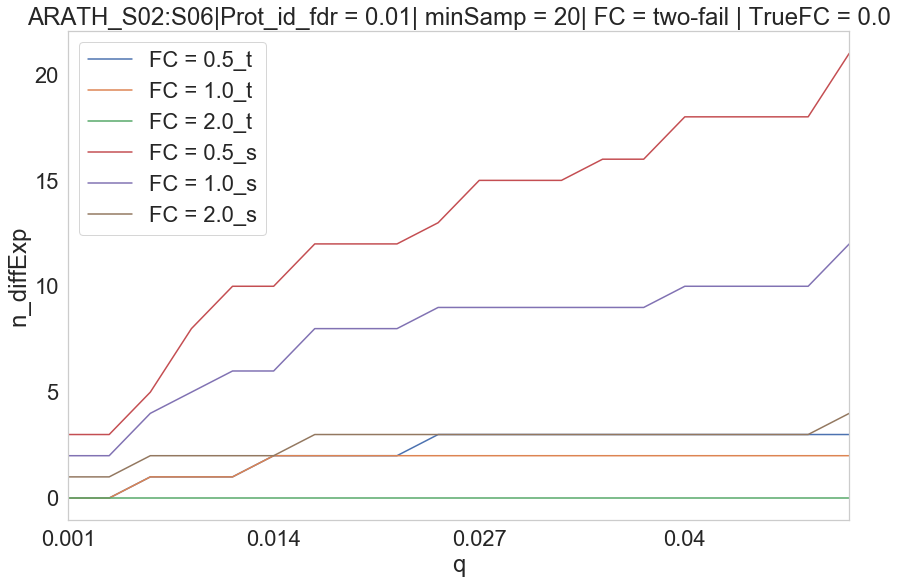
2020-07-04 n differentially expressed proteins vs q-value plot.
HUMAN S02 vs S06
CAEEL S02 vs S06
ARATH S02 vs S06
2020-07-03 Differential expression.
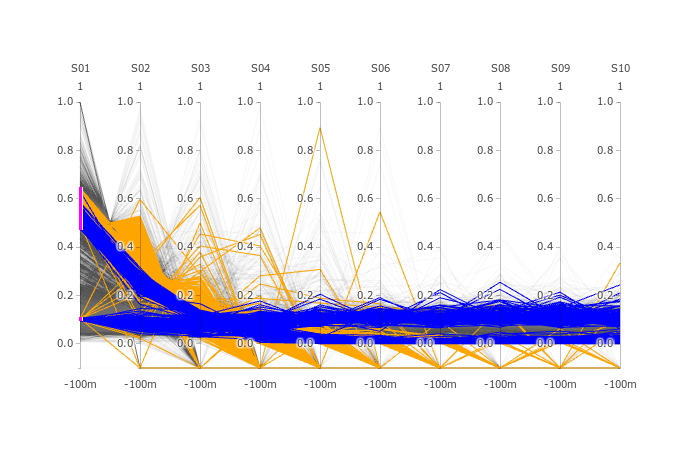
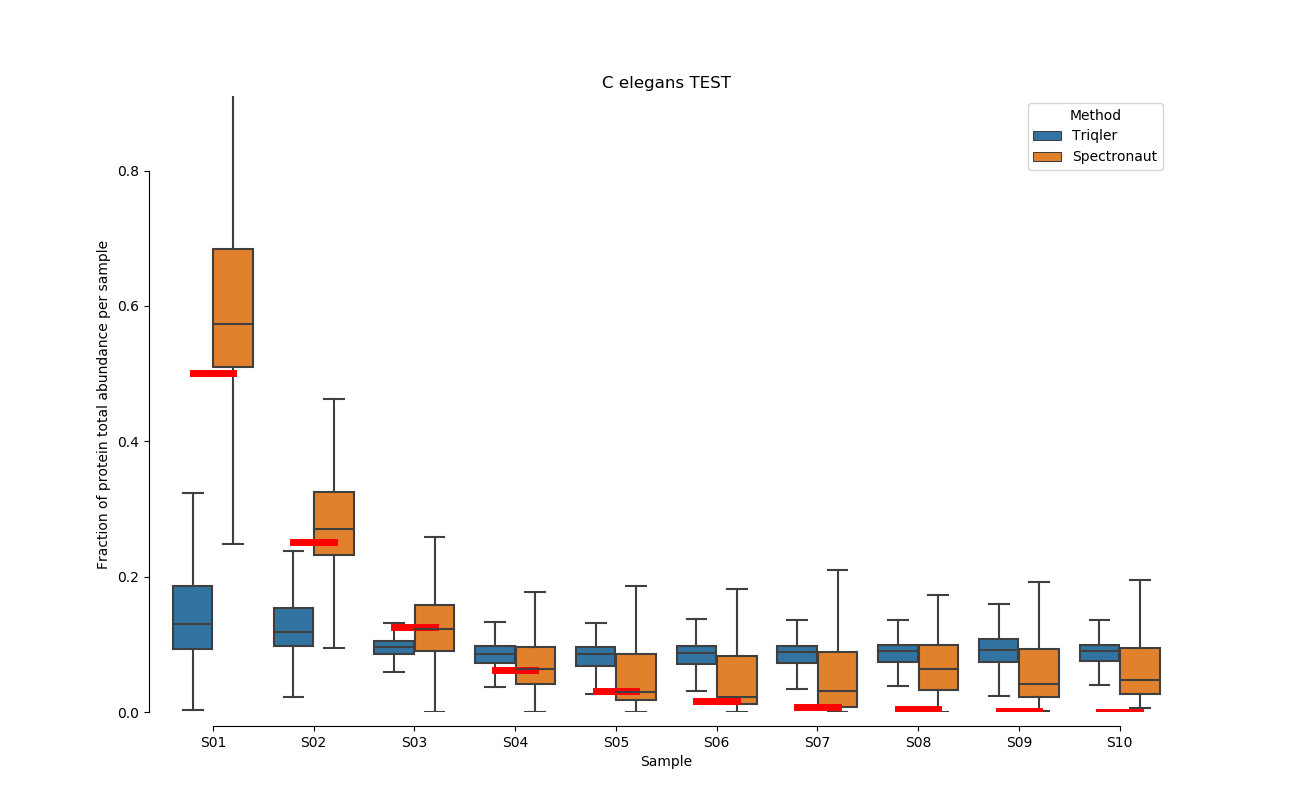
Parameters Treshold on protein id. PG.Qvalue < 0.01 Q-value based on protein_id_posterior_error_prob expanding mean < 0.01 -0.1 values on Parallell coordinates are NaN. In parallell coordinates orange(Spectronaut), blue(triqler) and red line(true).
Same approach as previous entry was used to on all samples.
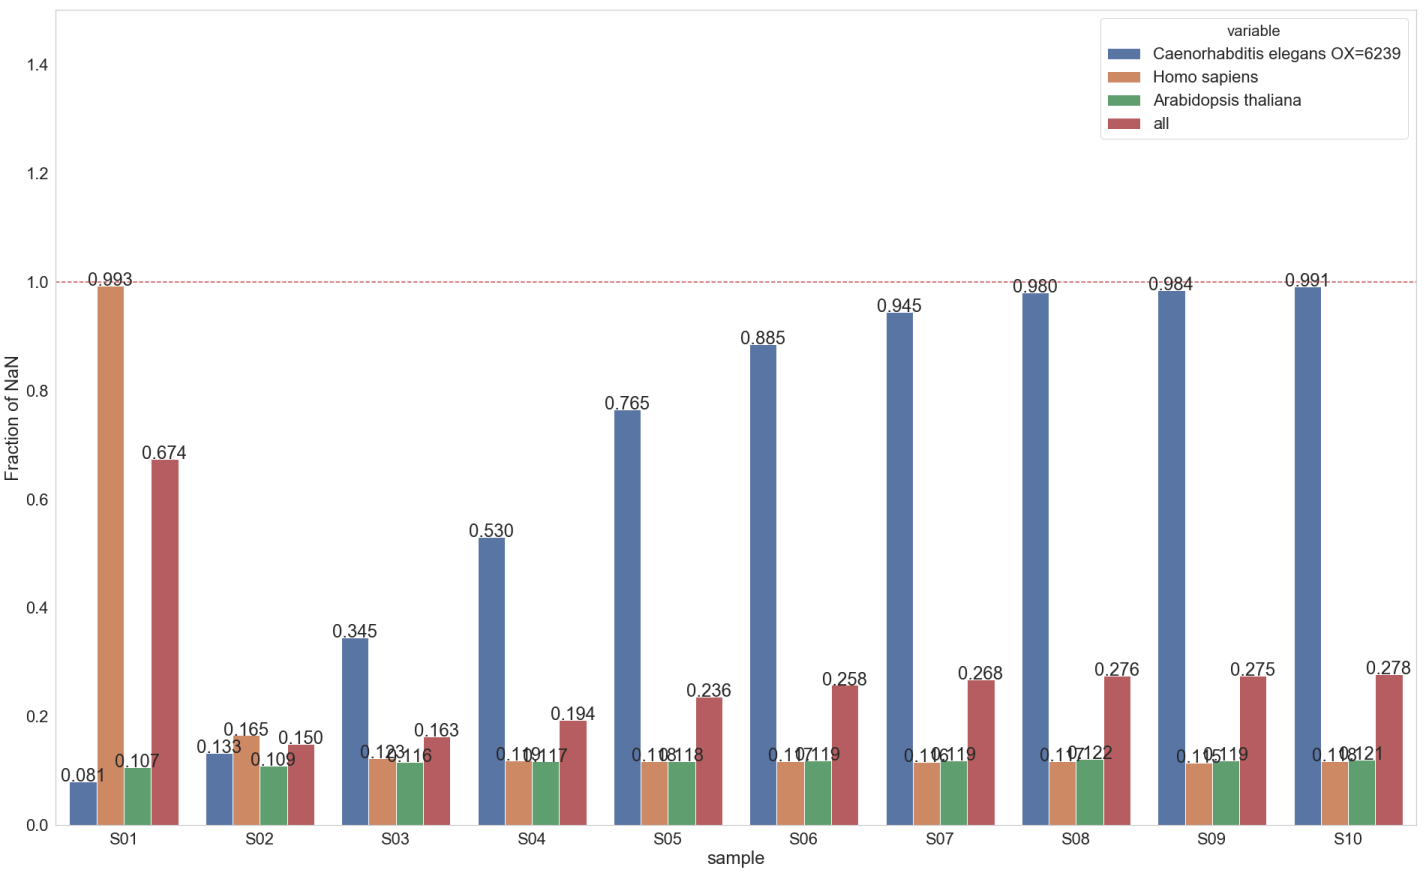
Missing values:
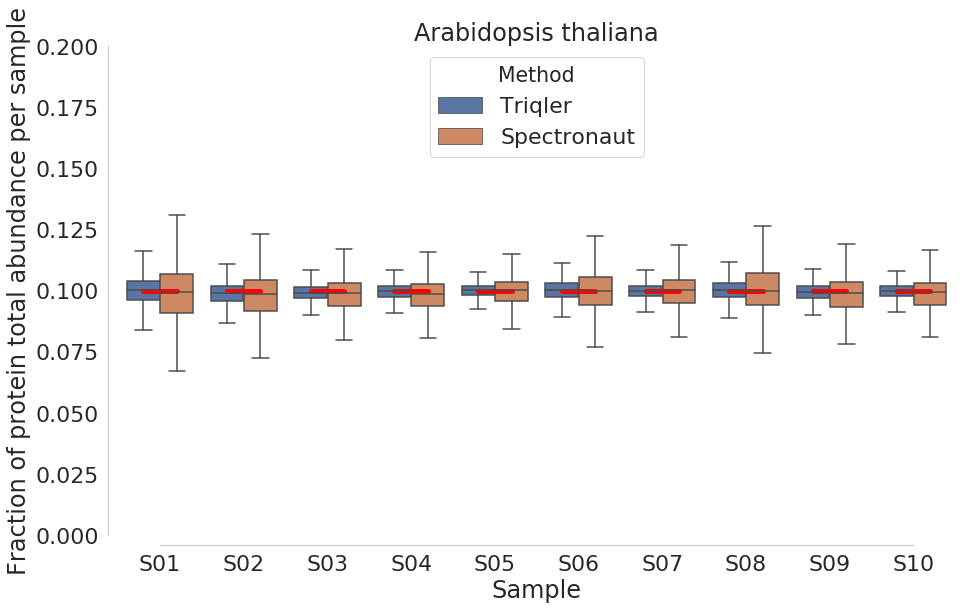
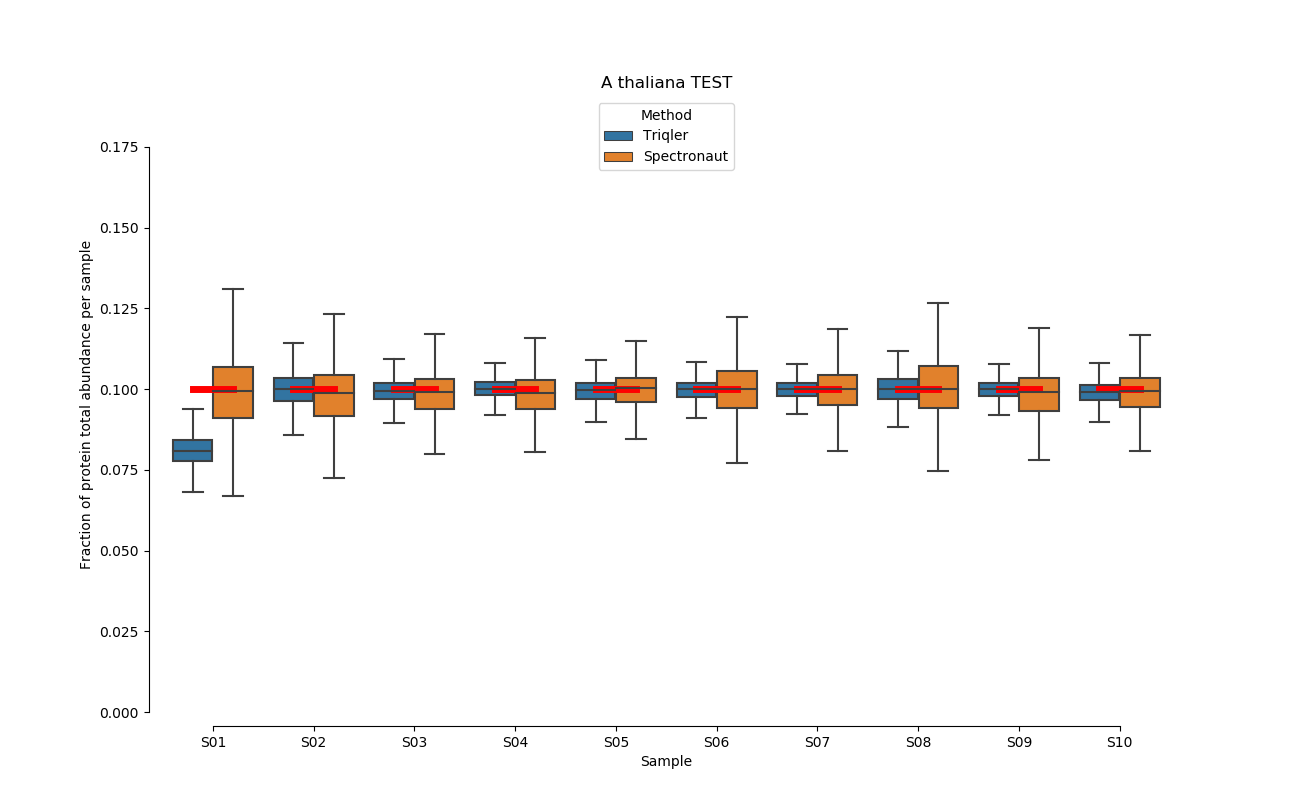
ARATH
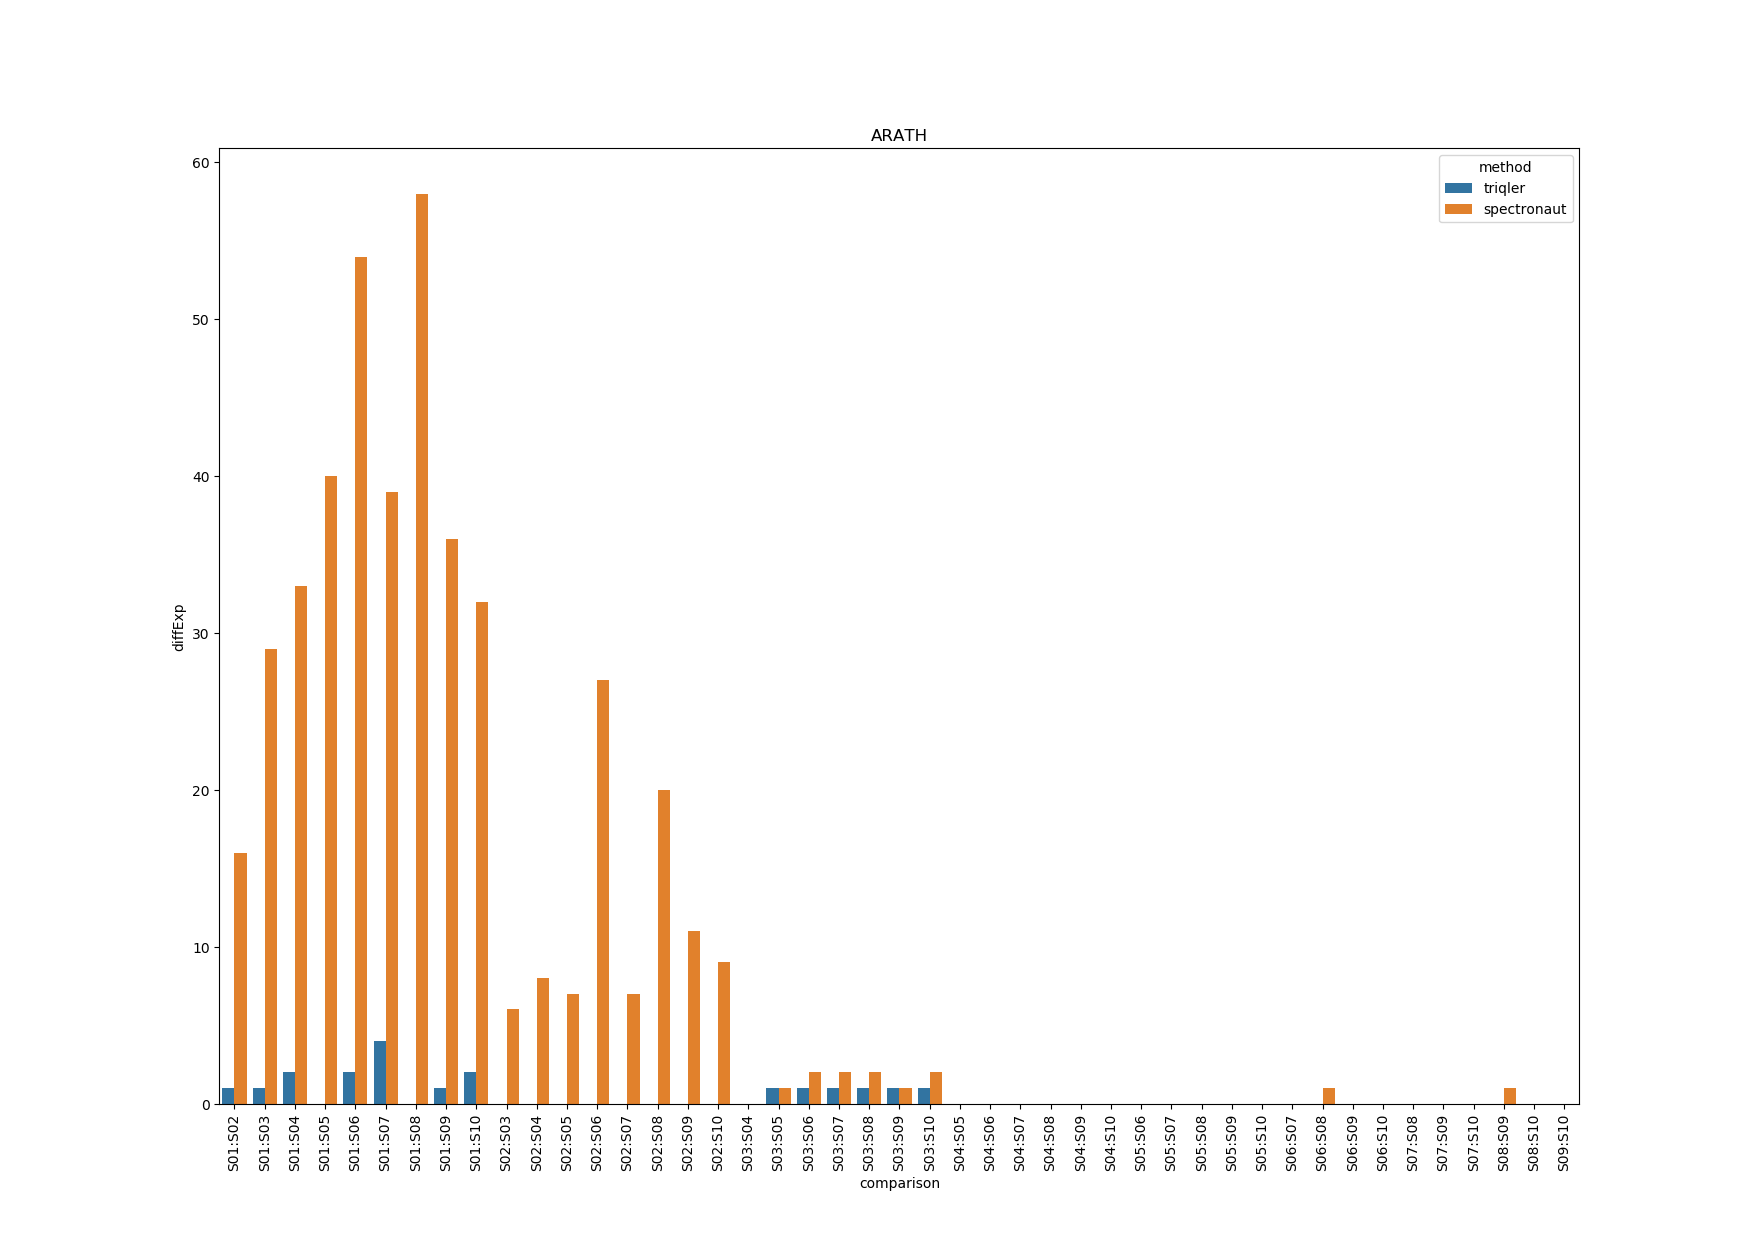
Triqler reports lower DE proteins than spectronaut.
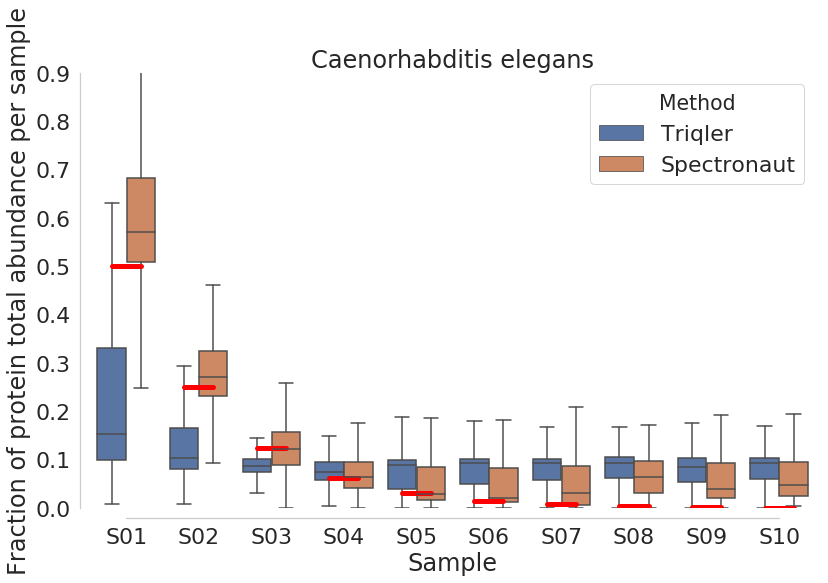
CAEEL
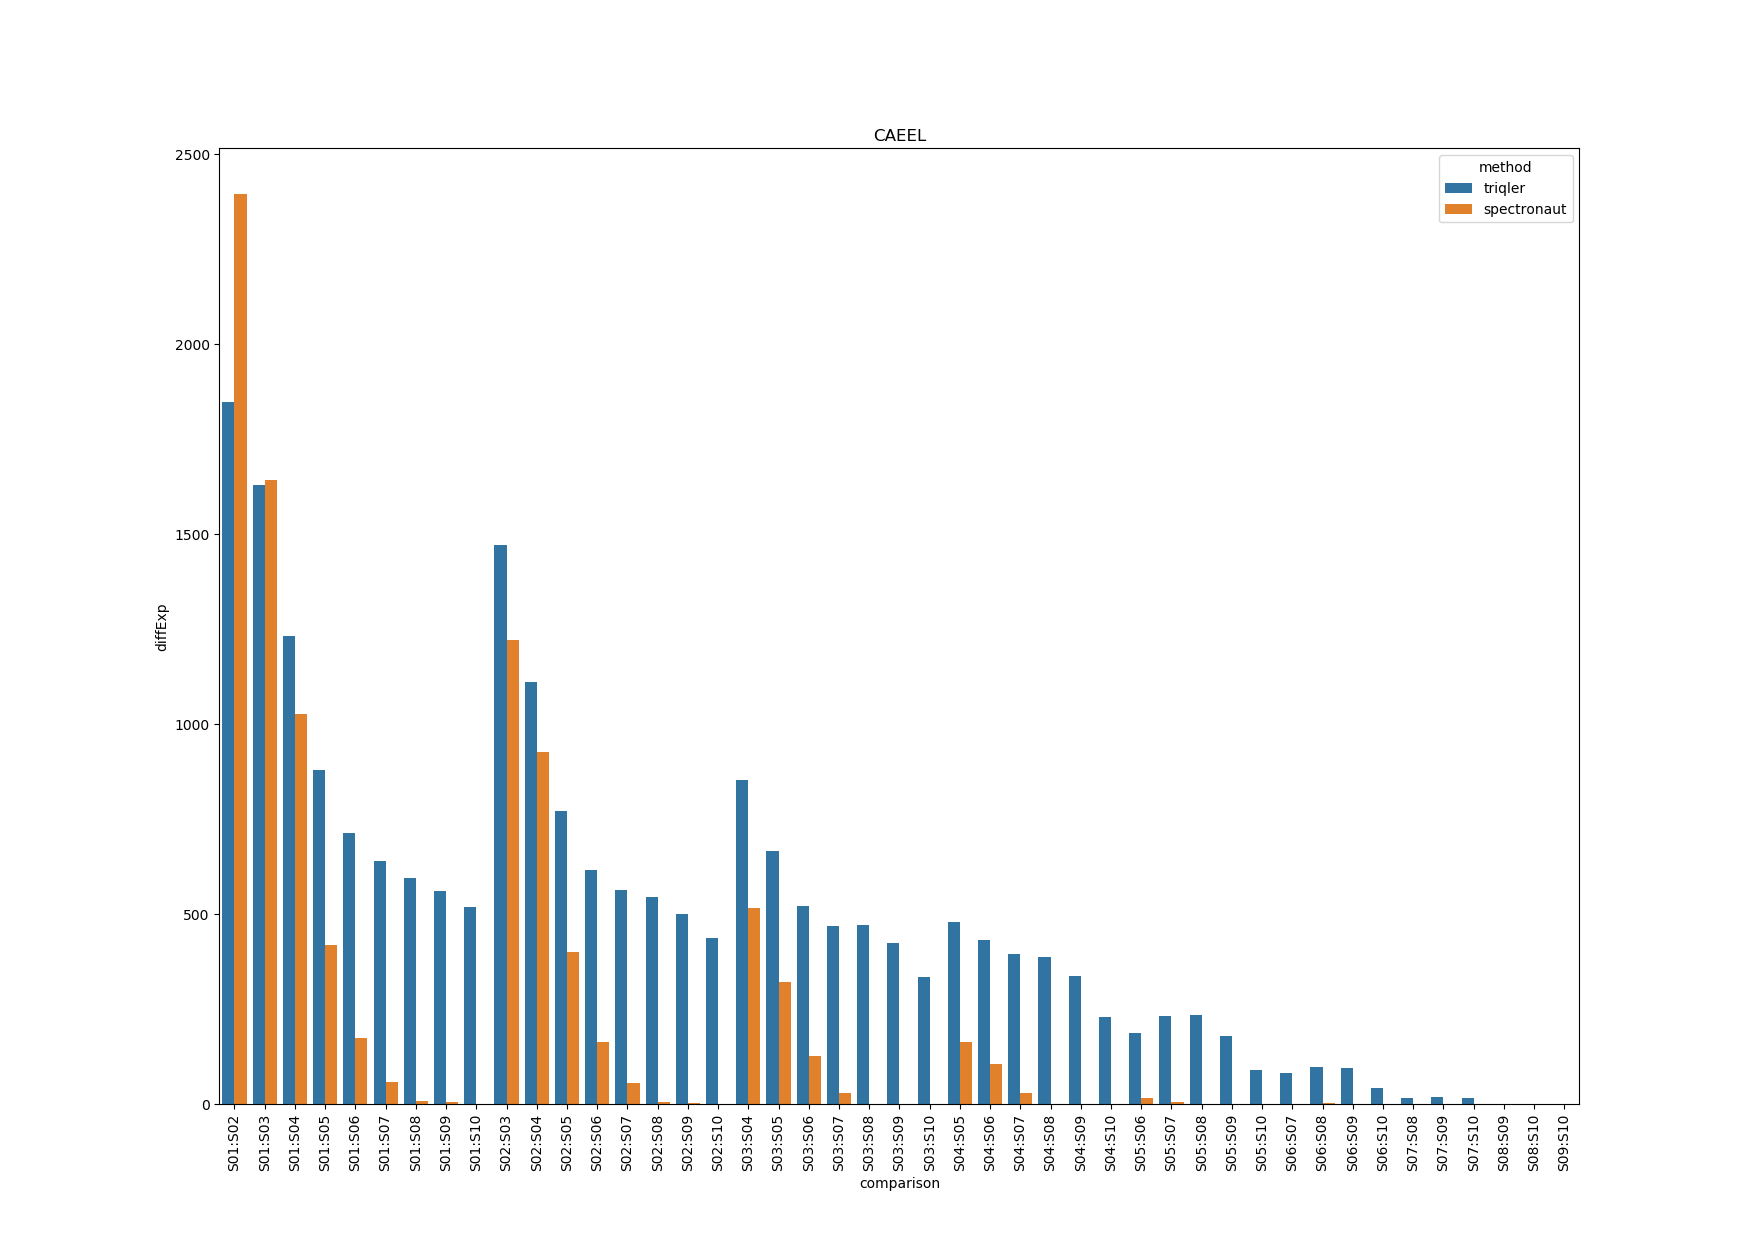
Spectronaut seems to have high DE proteins in S01:S02 and S01:S03. The drop-off in DE proteins is due to priors not being trained properly due to missing values.
There seems to be two groups of proteins in triqler. The group that is correctly quantified and the group where protein priors are not updated sufficiently, even though S01 does not have many missing values, in this case.
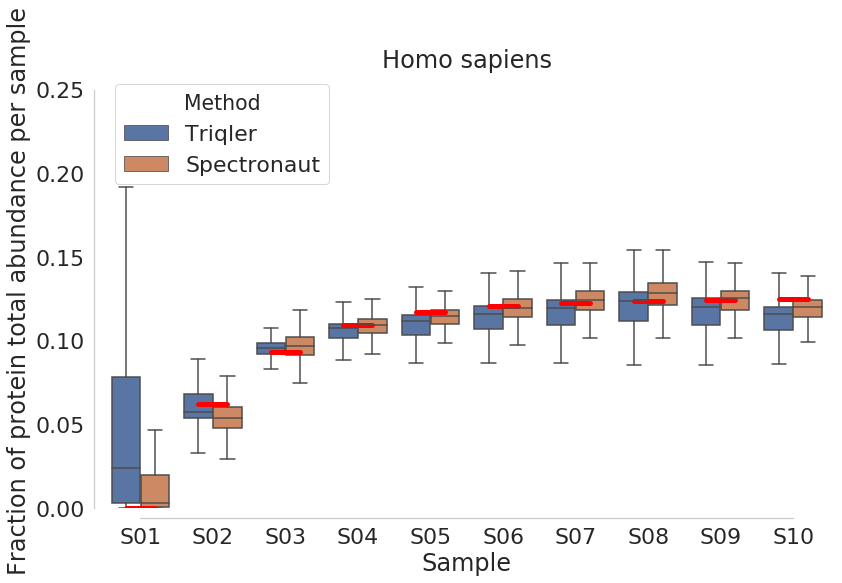
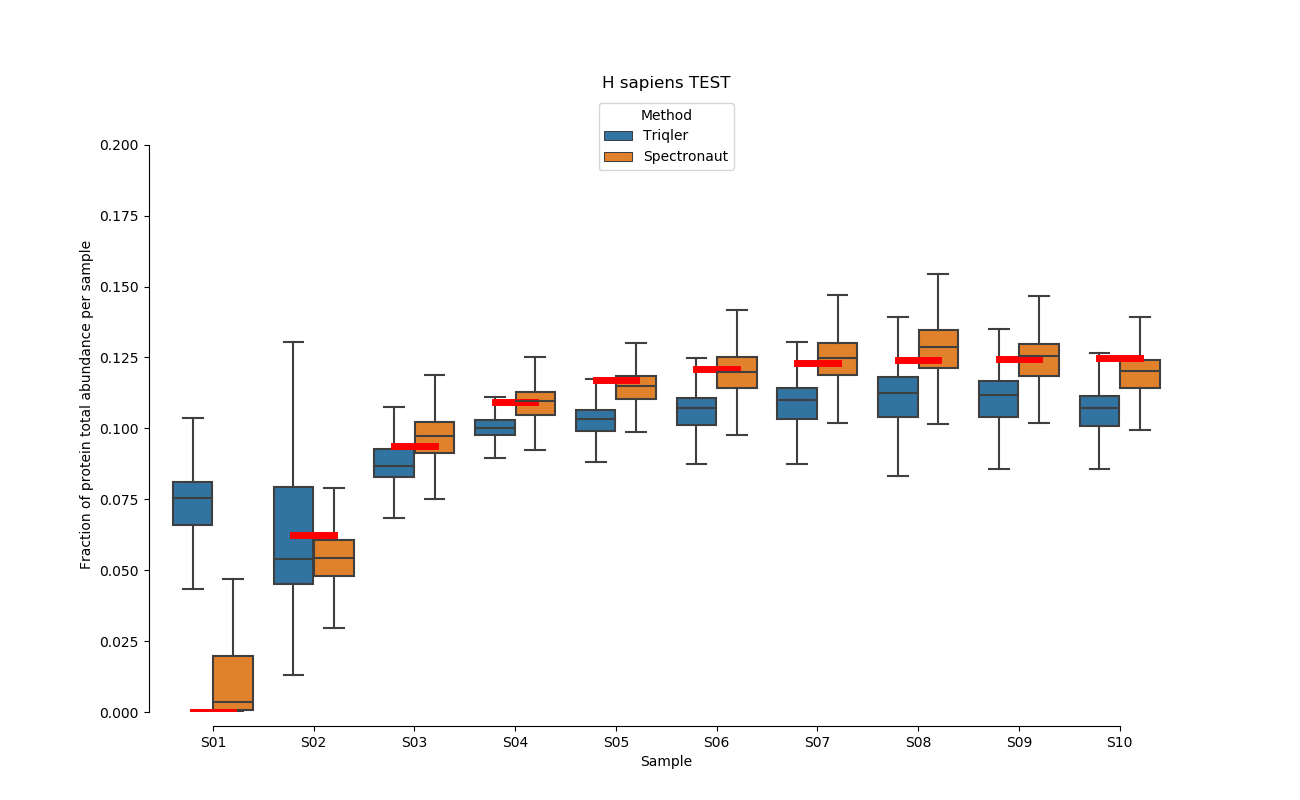
HUMAN Analysis
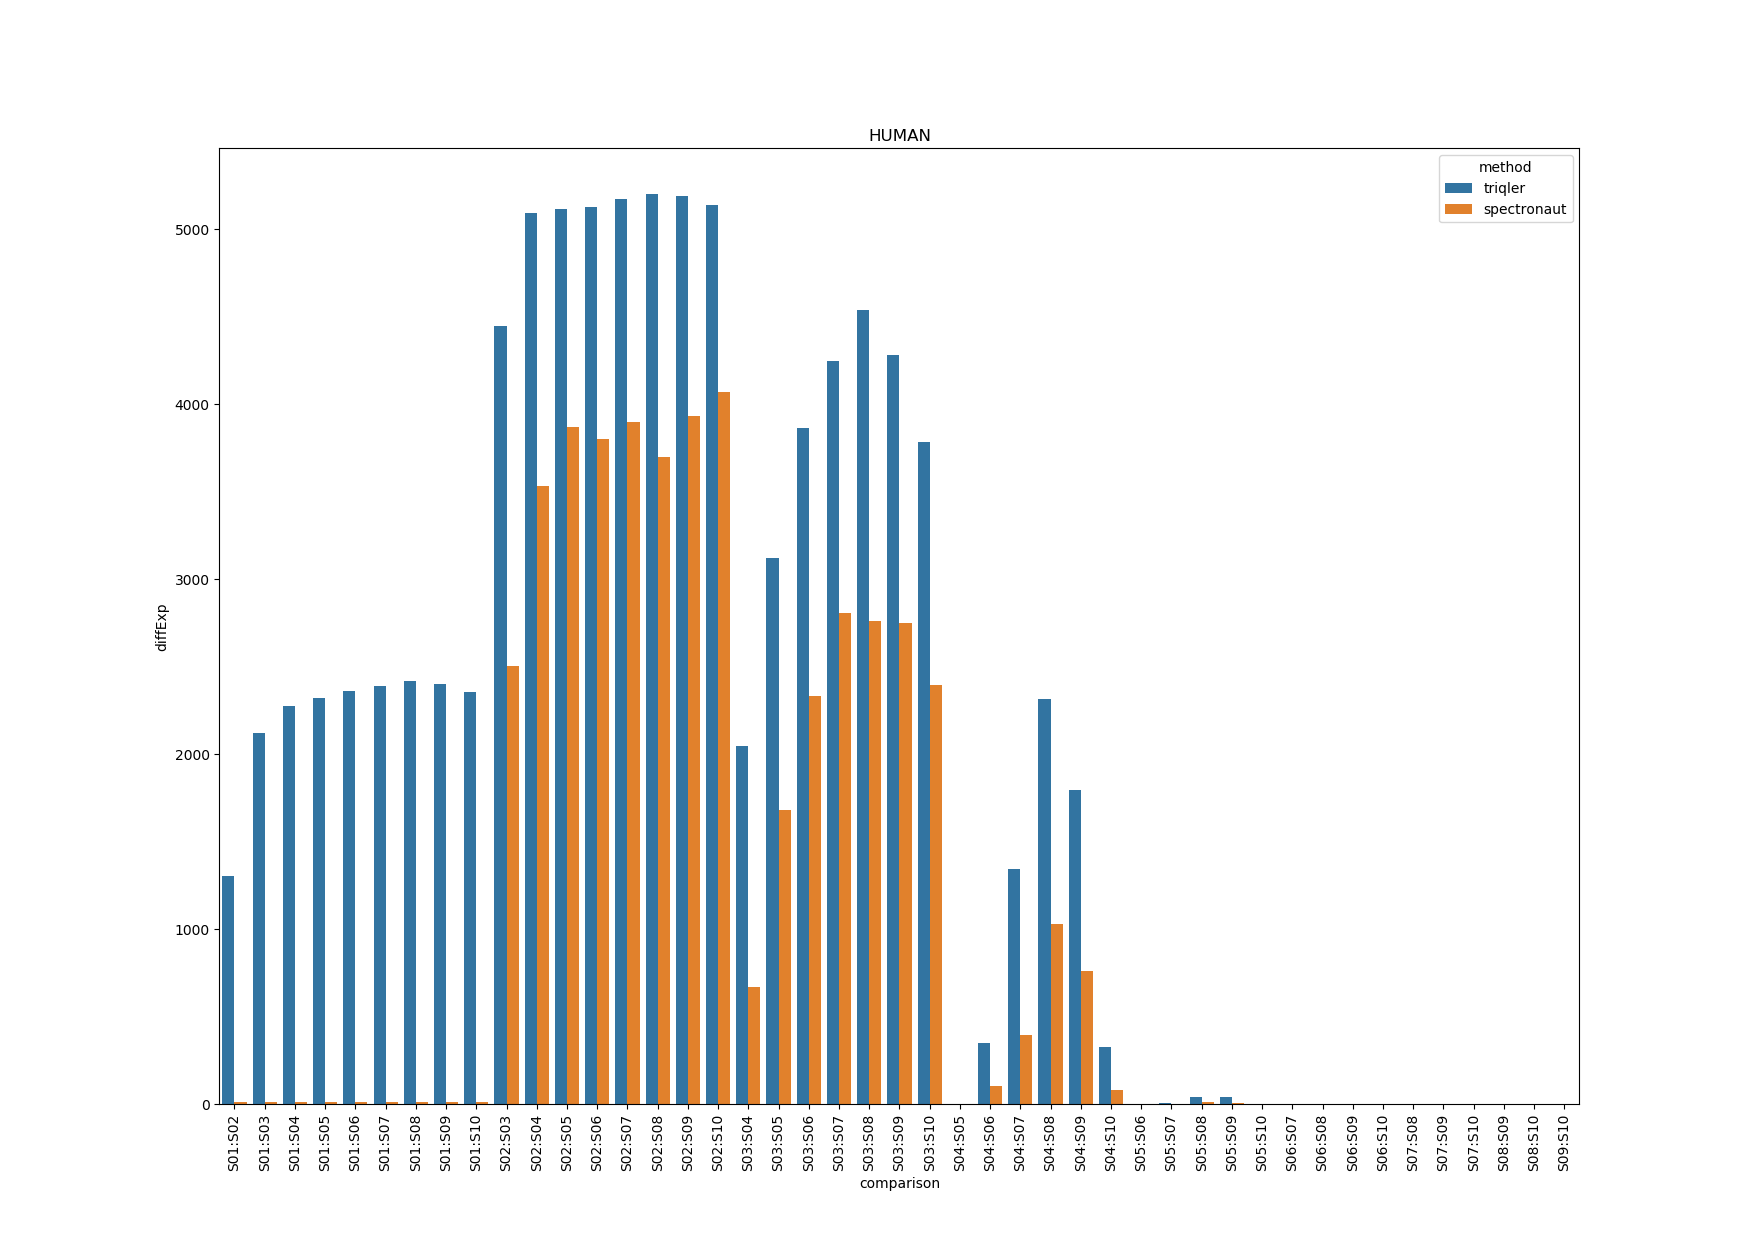
Note that triqler has less DE proteins between S01 and the other samples even though the fold-change between S01 and other samples are largest. The parallell coordinates show us.
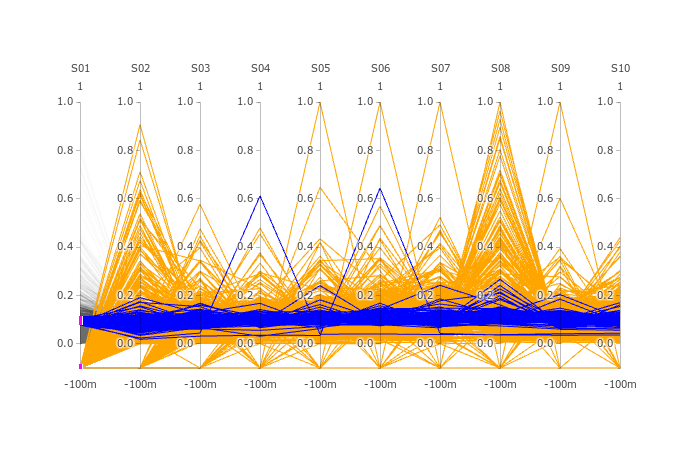
This shows us that a lot of the proteins have priors that are not correctly updated as S01 as these proteins simply are missing values for spectronaut. I am not sure about the drop of in DE proteins for comparisons between S03-S04:S08-S10. Since, S08-S10 have a increasing relative FC.
Note: that high spectronaut values (>0.8) in parallell coordinates are caused by missing values or outlier values (which are much larger).
parallell coordinates are presented below.
2020-07-02 Volcano plot S02 vs S06 with correct FC range.
Parameters Treshold on protein id. PG.Qvalue < 0.01 Q-value based on protein_id_posterior_error_prob expanding mean < 0.01
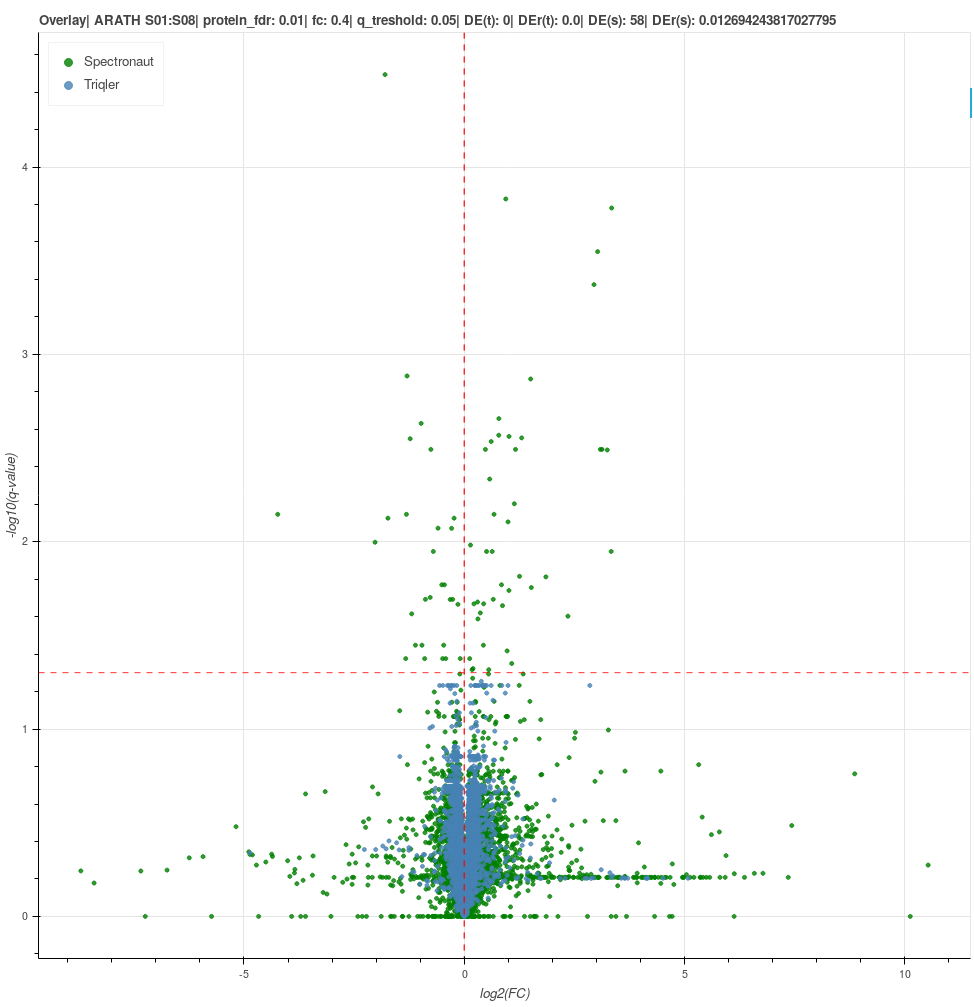
We investigate amount of differential expression in the vicinity of true FC. The interval range was based on trueFC/2 for CAEEL and HUMAN. For ARATH no FC interval was used, since all registered diffExp are false.
Differentially expressed proteins
| Method | ARATH | CAEEL | HUMAN |
|---|---|---|---|
| Triqler | 3 | 615 | 5128 |
| Spectronaut | 37 | 162 | 3785 |
q-value Overlay ARATH FC = 0.0
q-value Overlay CAEEL FC = -6 < FC < -2
q-value Overlay HUMAN FC = 0.475 < FC < 1.425
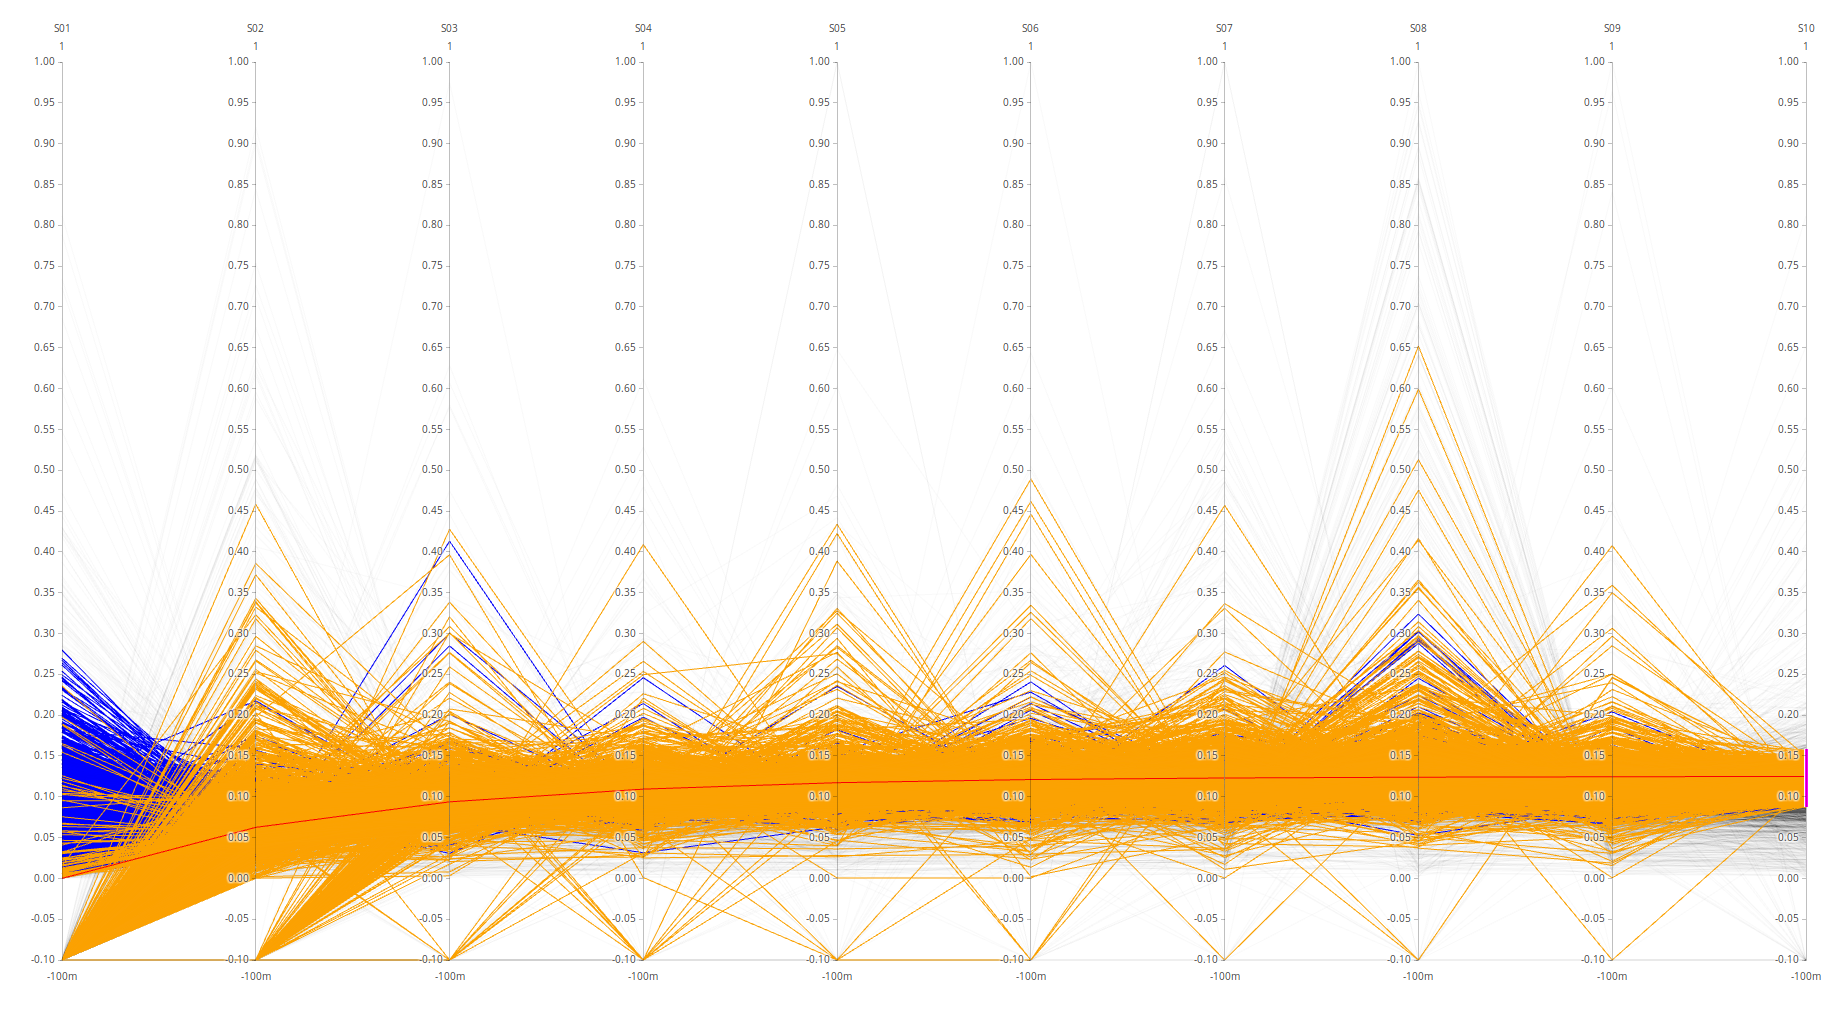
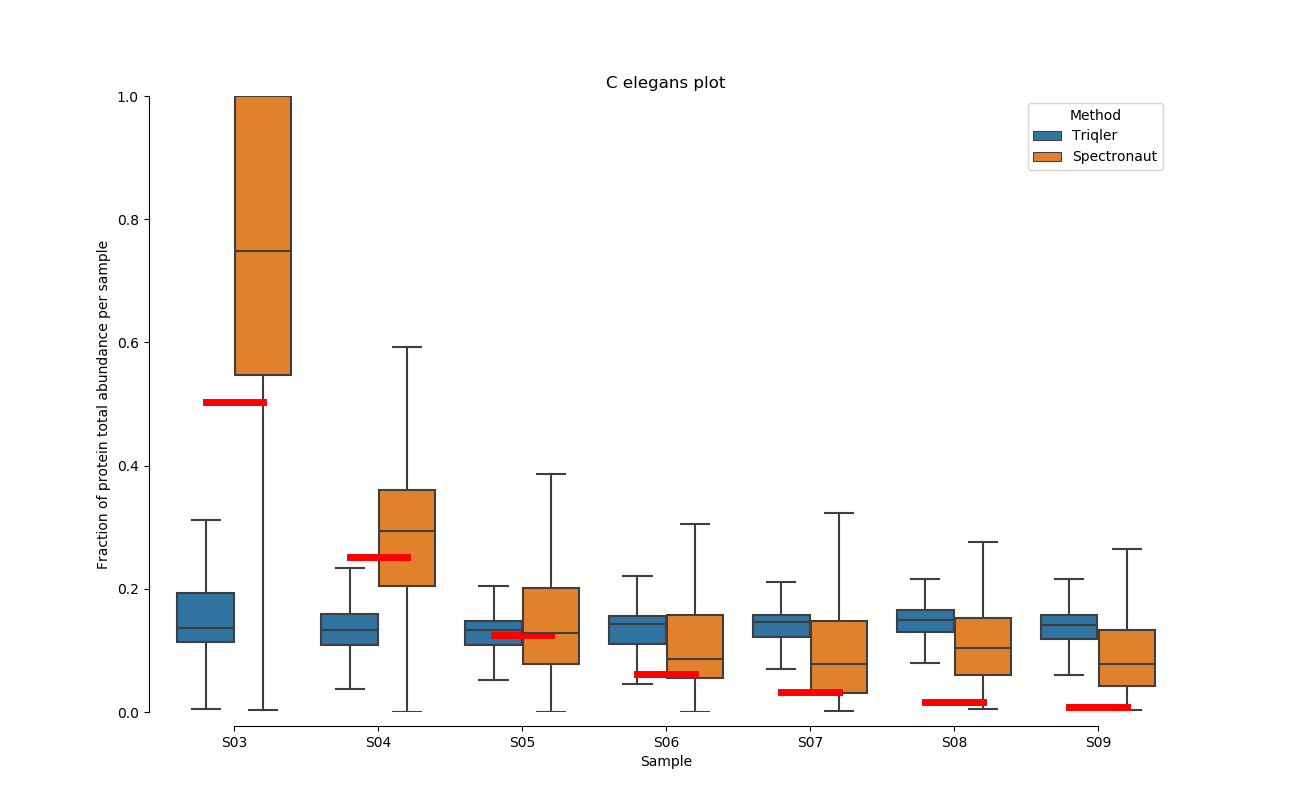
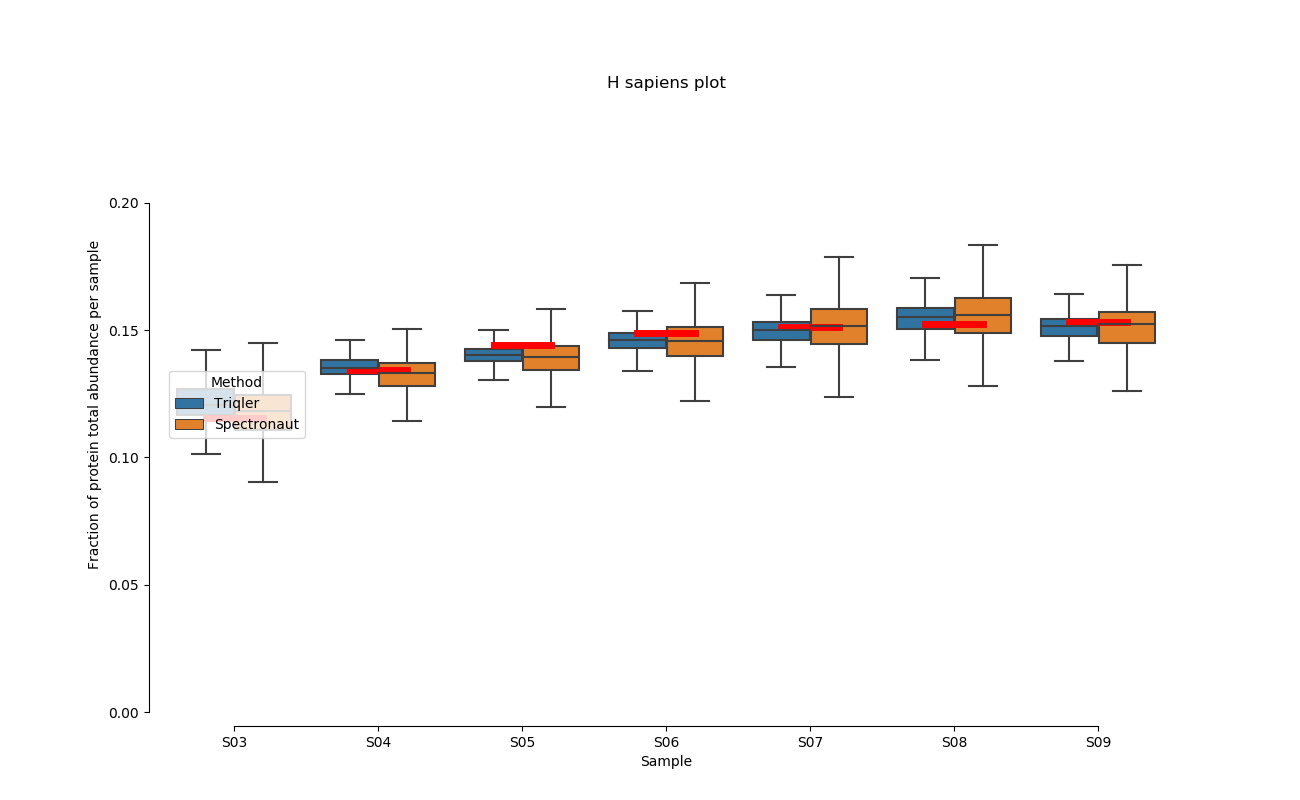
2020-07-02 Parallell coordinates, highlights.
Parameters:
Treshold
PG.Qvalue < 0.01
Q-value based on protein_id_posterior_error_prob expanding mean < 0.01
Samples are averaged to concatenate runs.
Normalization on proteins (row-wise) resulting in fractions.
Orange line - Spectronaut.
Blue line - triqler.
red line - true fractions.
NOTE: -0.1 values in parallell coordinates are NaN:s converted to -0.1.
CAEEL.
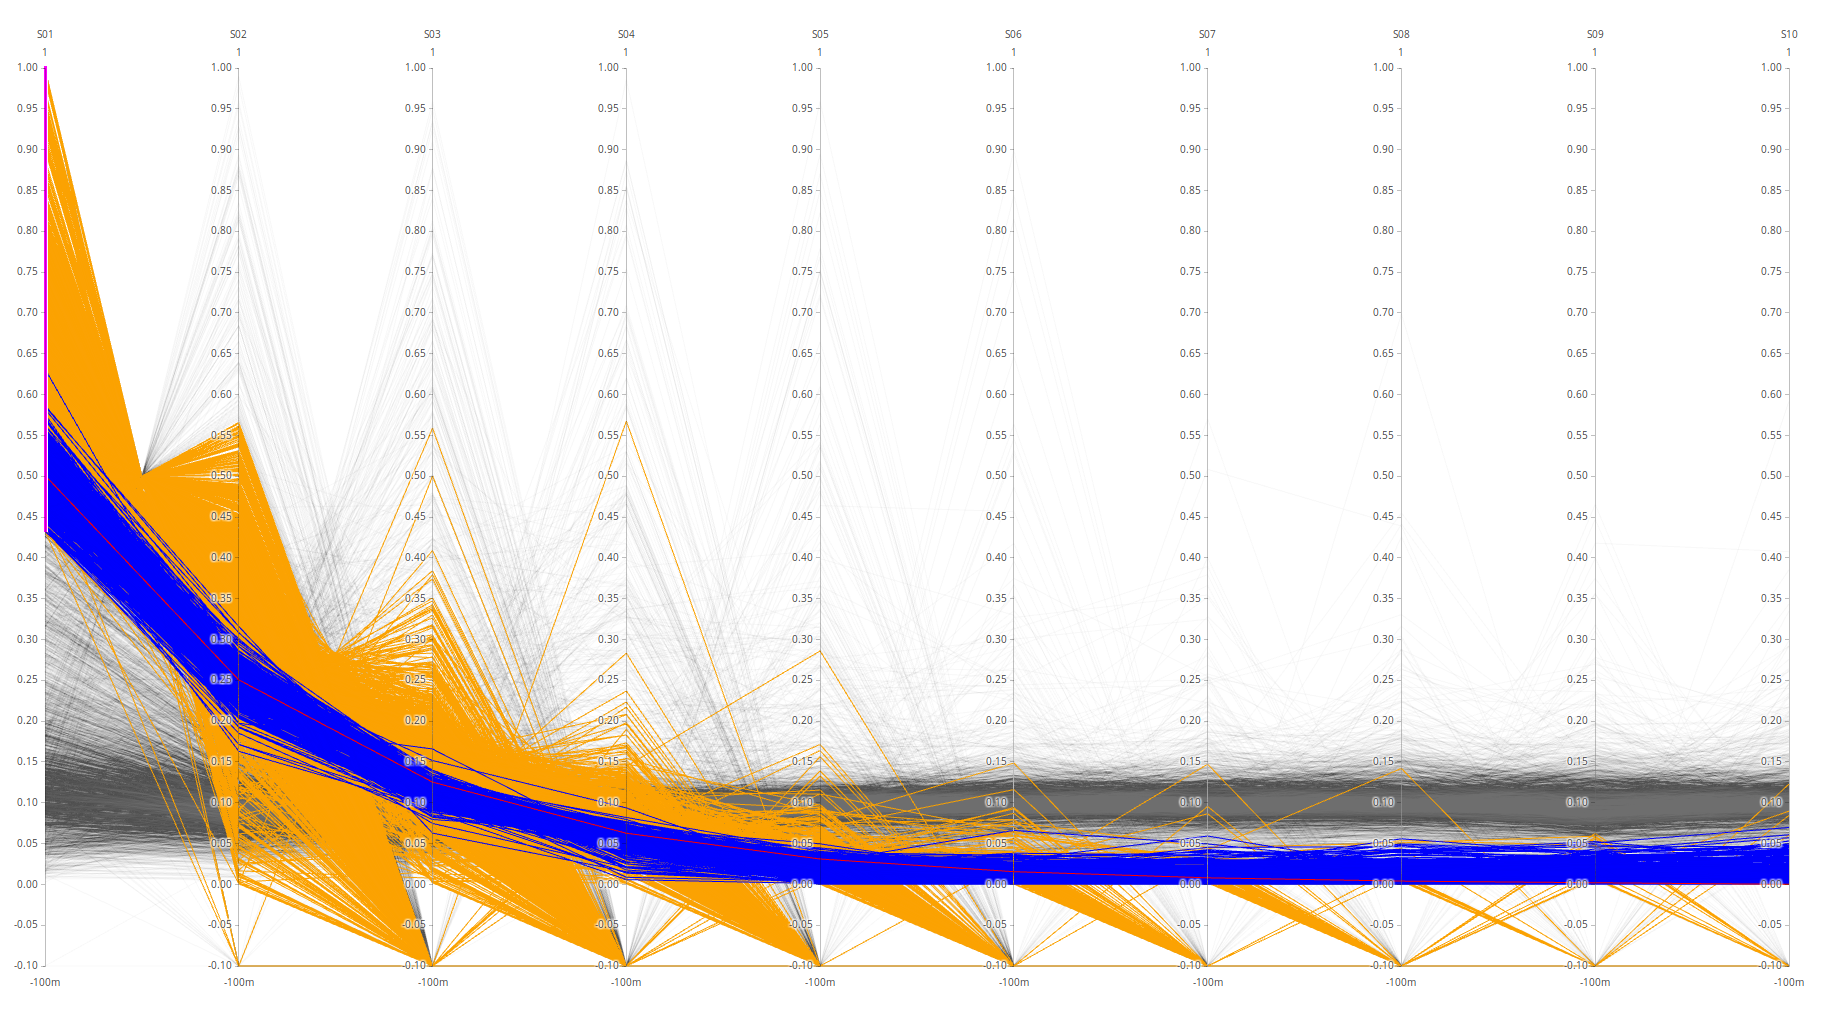
HUMAN - triqler on top.
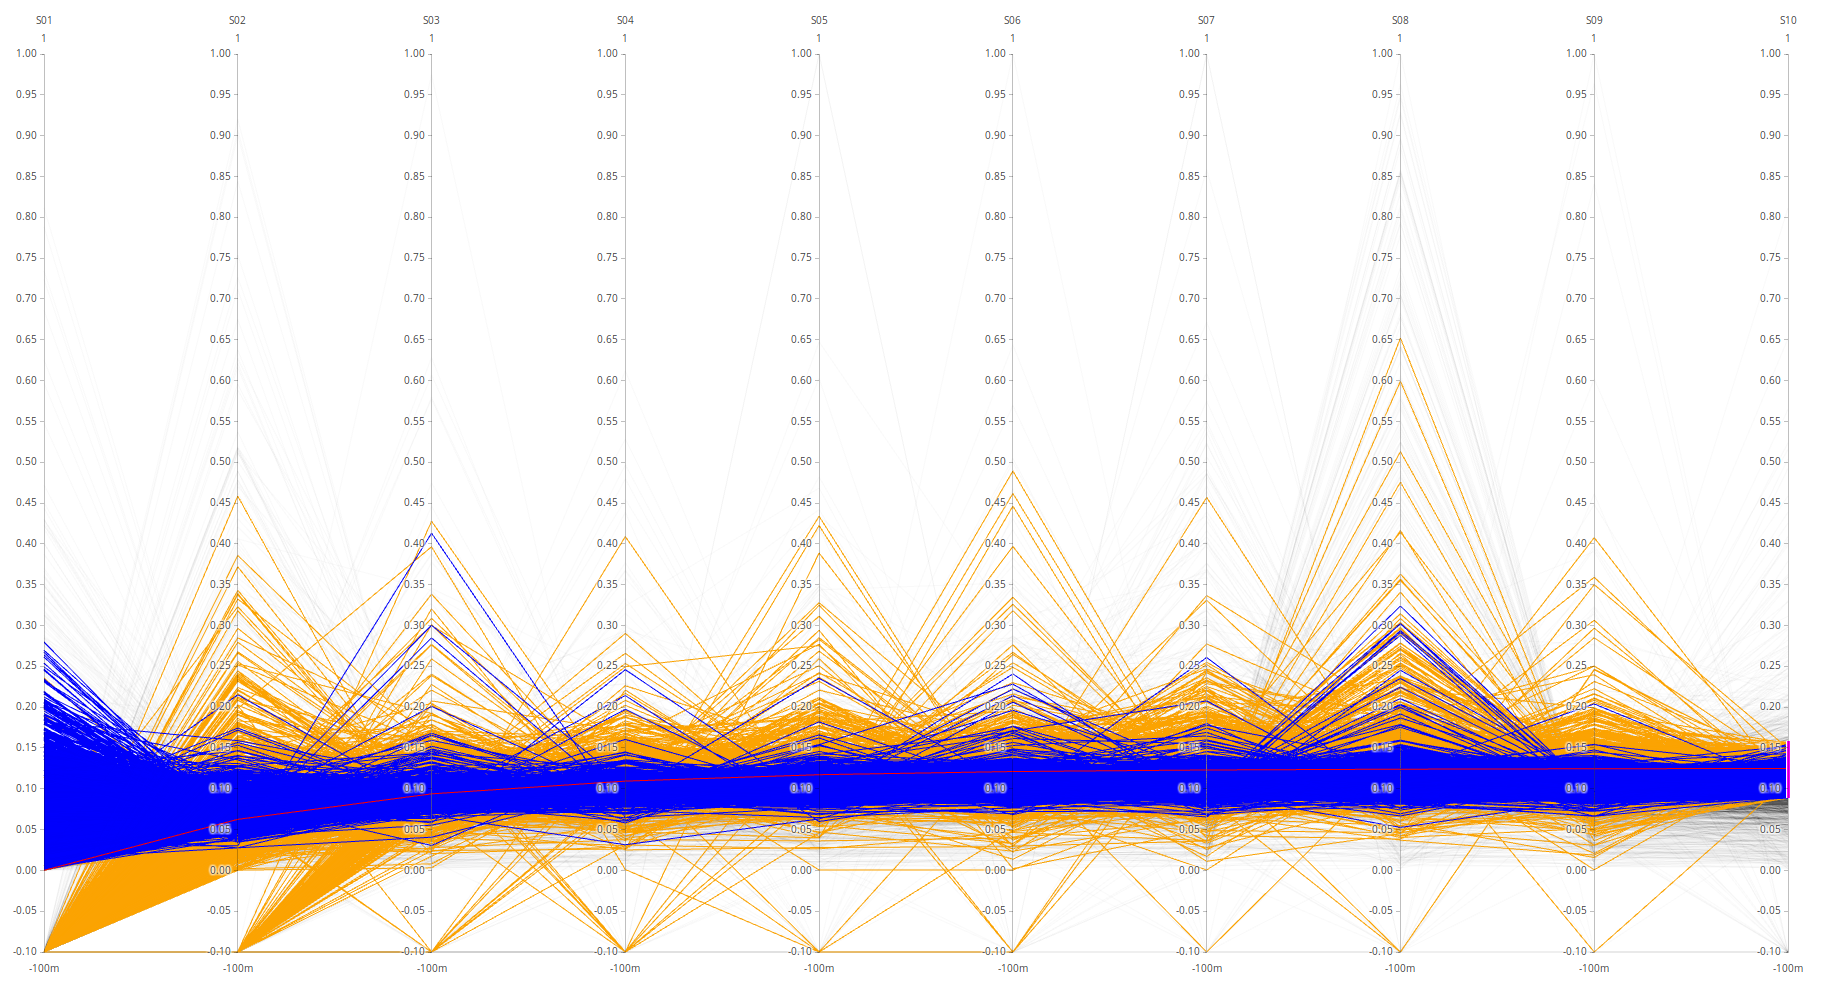
HUMAN - spectronaut on top.
2020-07-01 Thoughts on volcano plots, parallell coordinates and data processeing.
Notes on data processing for volcano plot and parallell coordinates on previous posts…
The FDR used was on protein identification FDR. For spectronaut PG.Qvalue < 0.01 was used and for triqler protein_id_posterior_error_prob converted to q-value < 0.01 was used.
...
triqler.sort_values(by = "protein_id_posterior_error_prob", inplace = True)
triqler["FDR"] = triqler["protein_id_posterior_error_prob"].expanding().mean()
triqler = triqler[triqler["FDR"] < 0.01]
...
protein_id_posterior_error_prob is calculated from “searchScore” in triqler input (which is the PG.Cscore). The PG.Cscore are converted to PEP-values and these PEP-values are then logarthimed and summed for target and decoy proteins.
Parallell coordinates notes…
The data is normalized protein-wise (row-wise). High spectronaut values (>0.8) are caused by normalization where one value is much bigger than the others or when there are lots of NaNs in the protein-row. Triqler has no NaNs and the plot therefore becomes a lot more “well-behaved”.
This could possibly be fixed by assuming proteins with a lot of NaNs are not clearly identified and should thus be omitted, and in the case of very large outlying proteins, either omit the protein or omit the outlier values.
volcano plot…
The triqler points are computed by t-testing the means from the posterior distributions for each protein. This does not fully utilize triqlers FC q-value computation abilities.
On the side note, these means from the posterior distributions seems to consistently perform in a more correct manner than spectronaut results. They are more centered around correct FC and have a better TP/(TP+FN) ratio.
2020-07-01 Volcano Plot S02 vs S06 and true FC.
The true log2FC S02 vs S06
| ARATH | CAEEL | HUMAN |
|---|---|---|
| 0.0 | -4.011587974275212 | 0.9545685707529938 |
p-value volcano FC = 0.8
p-value Overlay ARATH FC = 0.8
p-value Overlay CAEEL FC = 0.8
p-value Overlay HUMAN FC = 0.8
p-value Spectronaut ARATH FC = 0.8
p-value Spectronaut CAEEL FC = 0.8
p-value Spectronaut HUMAN FC = 0.8
p-value Triqler ARATH FC = 0.8
p-value Triqler CAEEL FC = 0.8
p-value Triqler HUMAN FC = 0.8
p-value volcano FC = True FC
p-value Overlay ARATH FC = True FC
p-value Overlay CAEEL FC = True FC
p-value Overlay HUMAN FC = True FC
p-value Spectronaut ARATH FC = True FC
p-value Spectronaut CAEEL FC = True FC
p-value Spectronaut HUMAN FC = True FC
p-value Triqler ARATH FC = True FC
p-value Triqler CAEEL FC = True FC
p-value Triqler HUMAN FC = True FC
q-value volcano FC = 0.8
q-value Overlay ARATH FC = 0.8
q-value Overlay CAEEL FC = 0.8
q-value Overlay HUMAN FC = 0.8
q-value Spectronaut ARATH FC = 0.8
q-value Spectronaut CAEEL FC = 0.8
q-value Spectronaut HUMAN FC = 0.8
q-value Triqler ARATH FC = 0.8
q-value Triqler CAEEL FC = 0.8
q-value Triqler HUMAN FC = 0.8
q-value volcano FC = True FC
q-value Overlay ARATH FC = True FC
q-value Overlay CAEEL FC = True FC
q-value Overlay HUMAN FC = True FC
q-value Spectronaut ARATH FC = True FC
q-value Spectronaut CAEEL FC = True FC
q-value Spectronaut HUMAN FC = True FC
q-value Triqler ARATH FC = True FC
q-value Triqler CAEEL FC = True FC
q-value Triqler HUMAN FC = True FC
Note the issue with pi0 = estimated or 1…
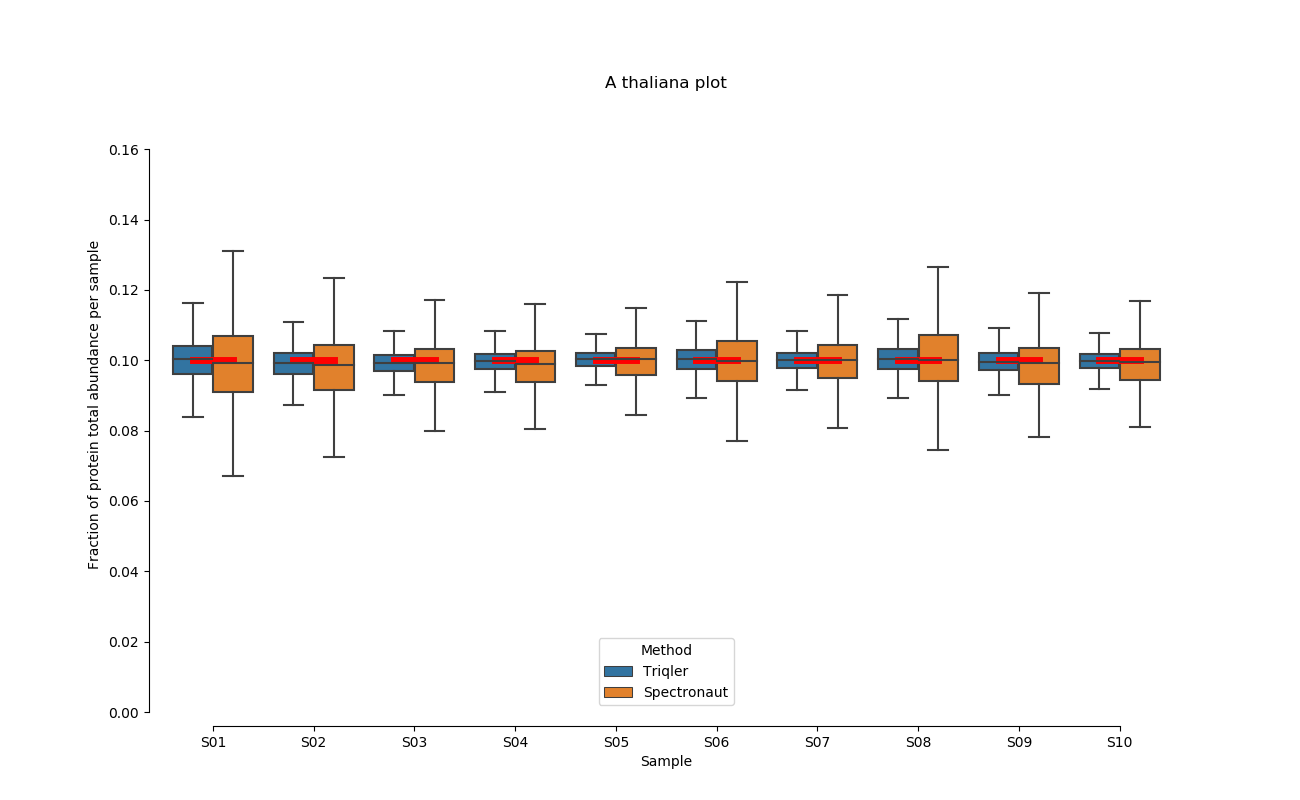
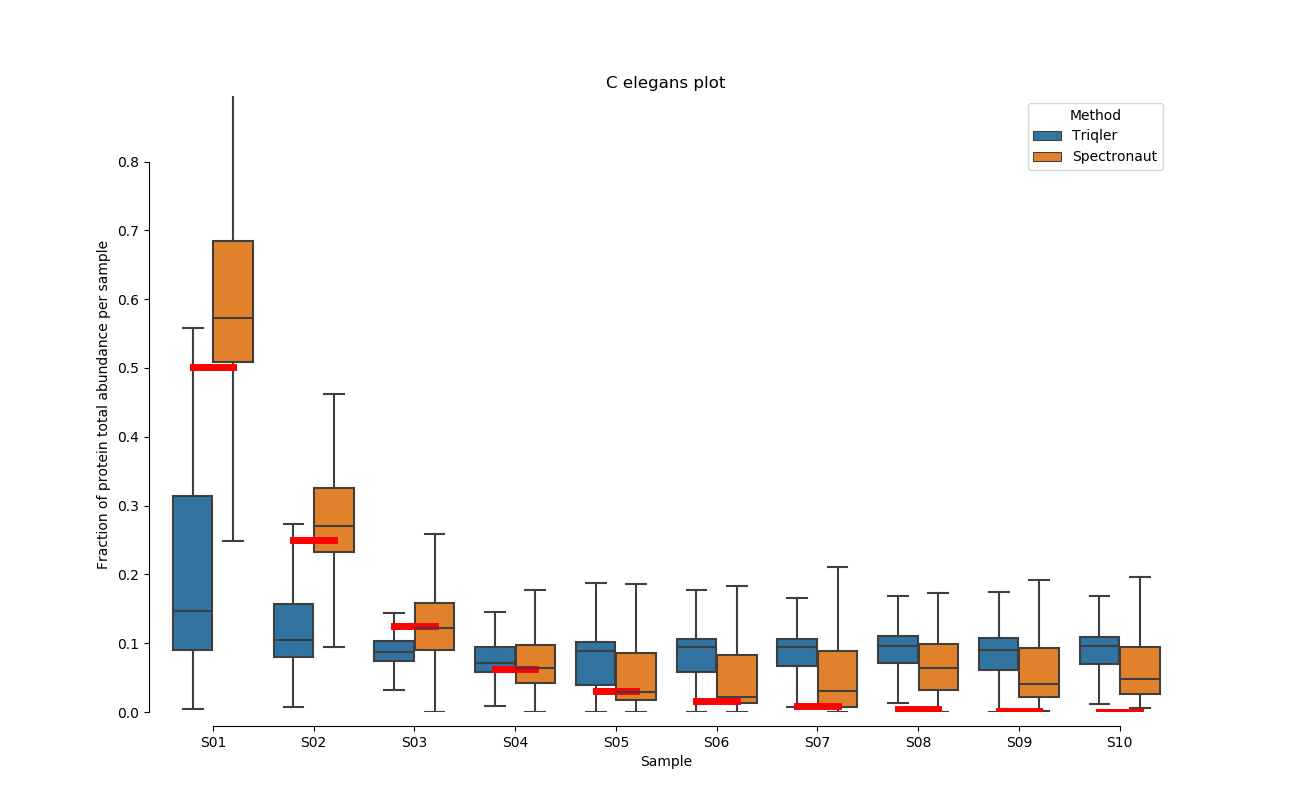
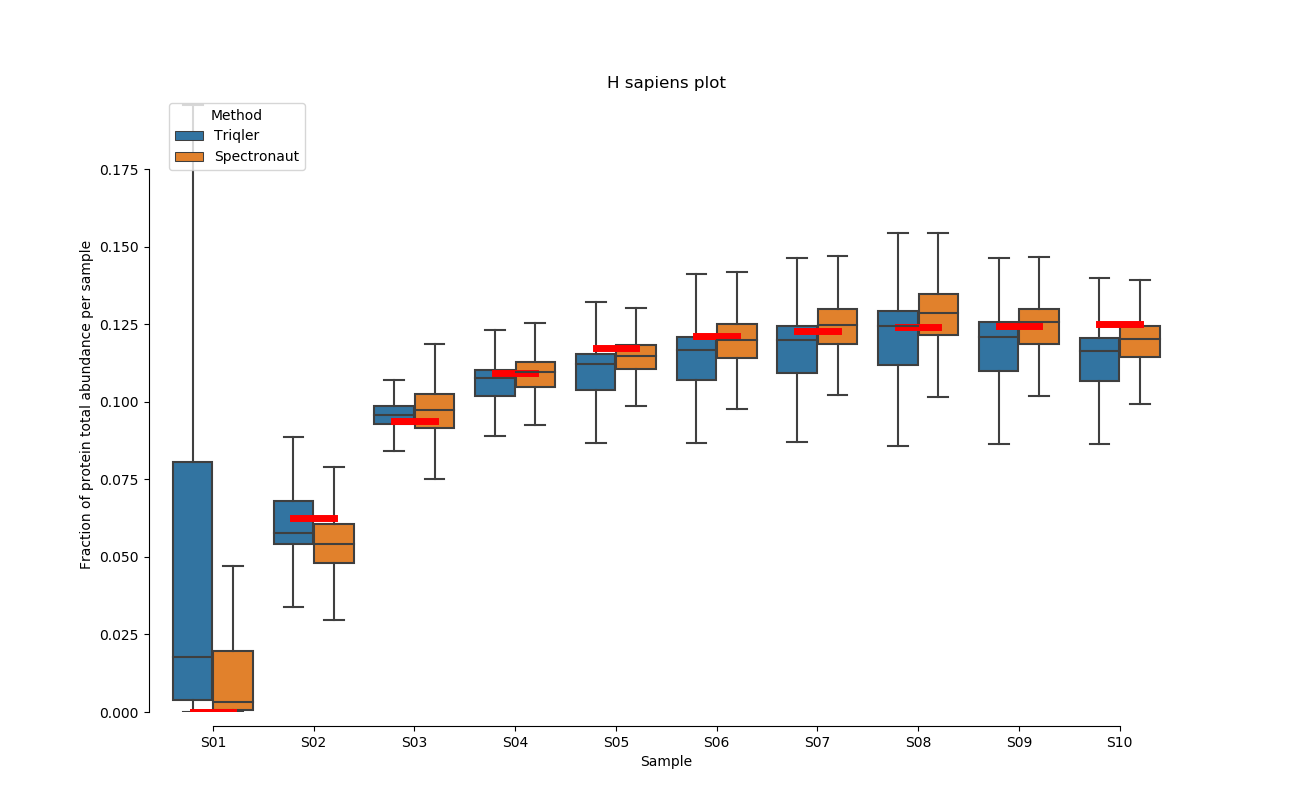
2020-06-30 Comparison plot for adjusted intensity and parallell plot for non-adjusted intensity.
full set
S02-S08
S03-S08
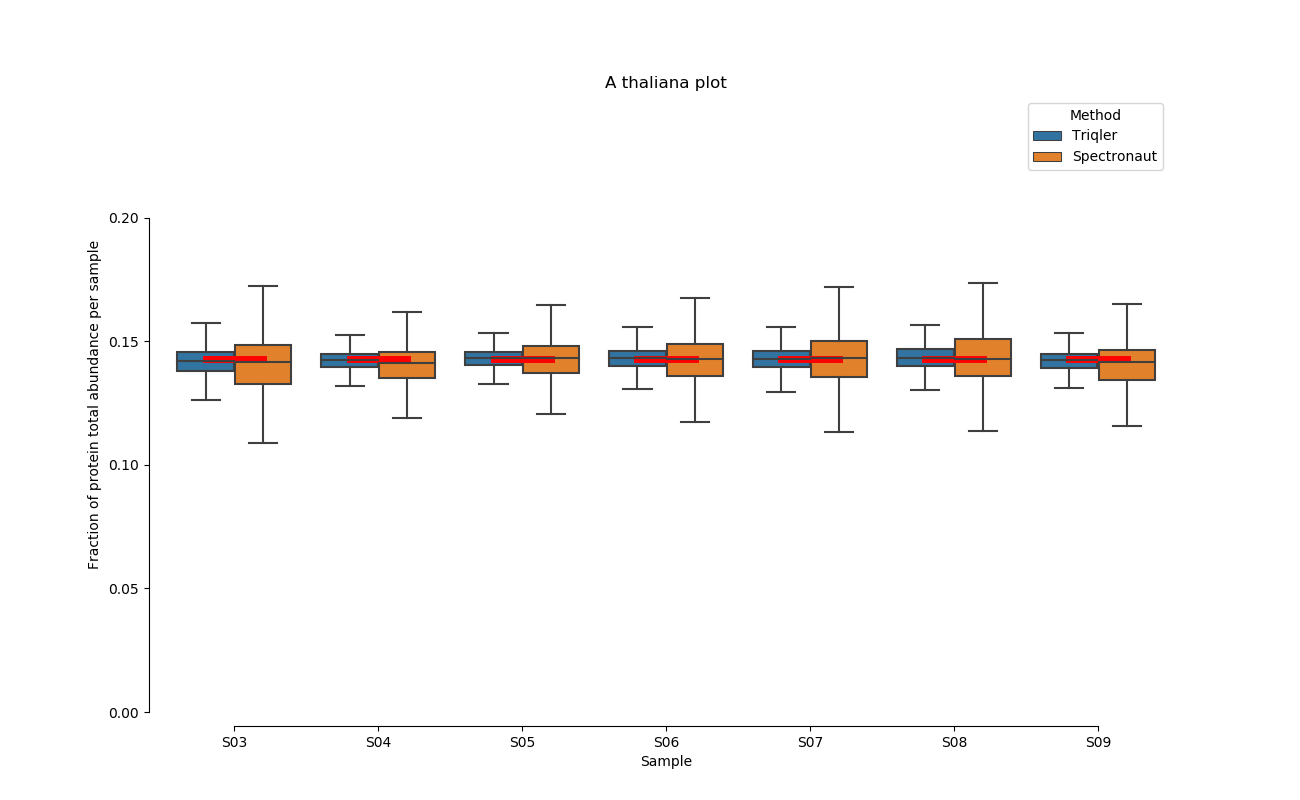
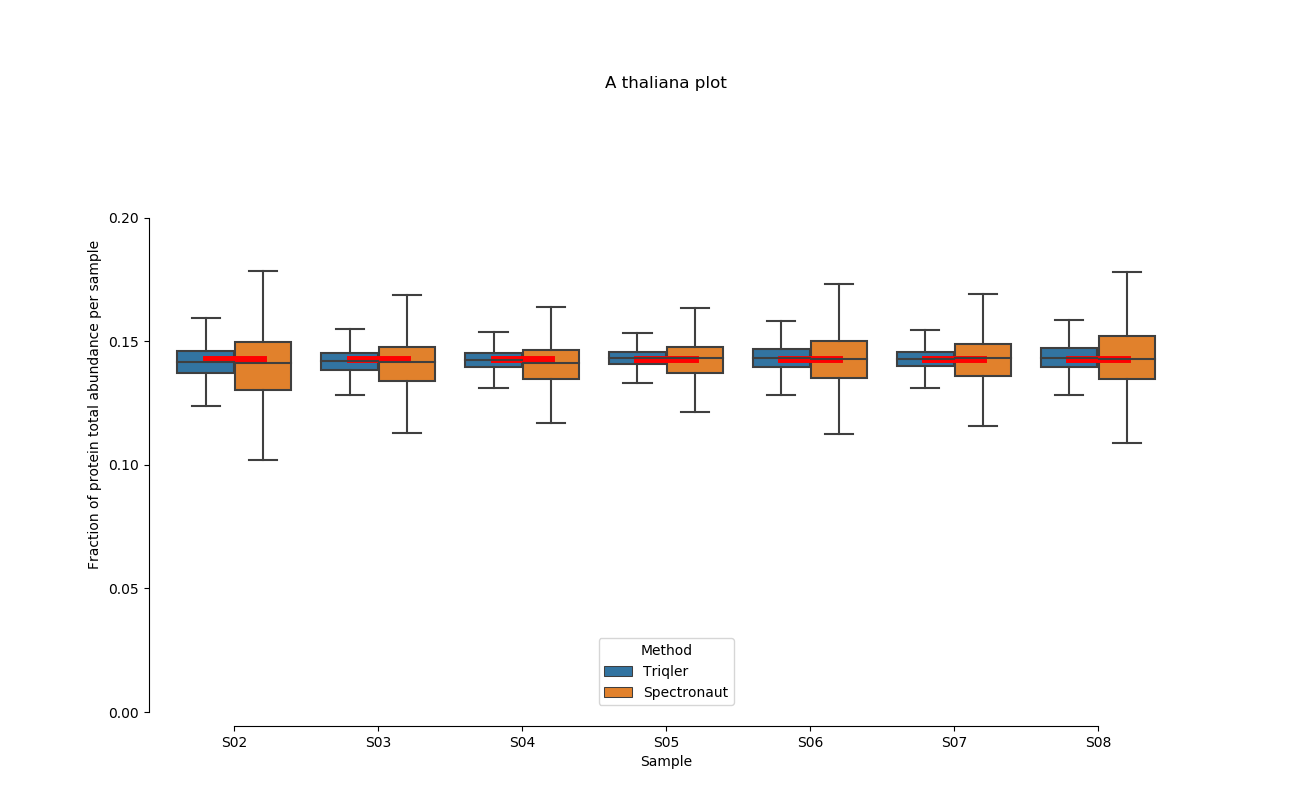
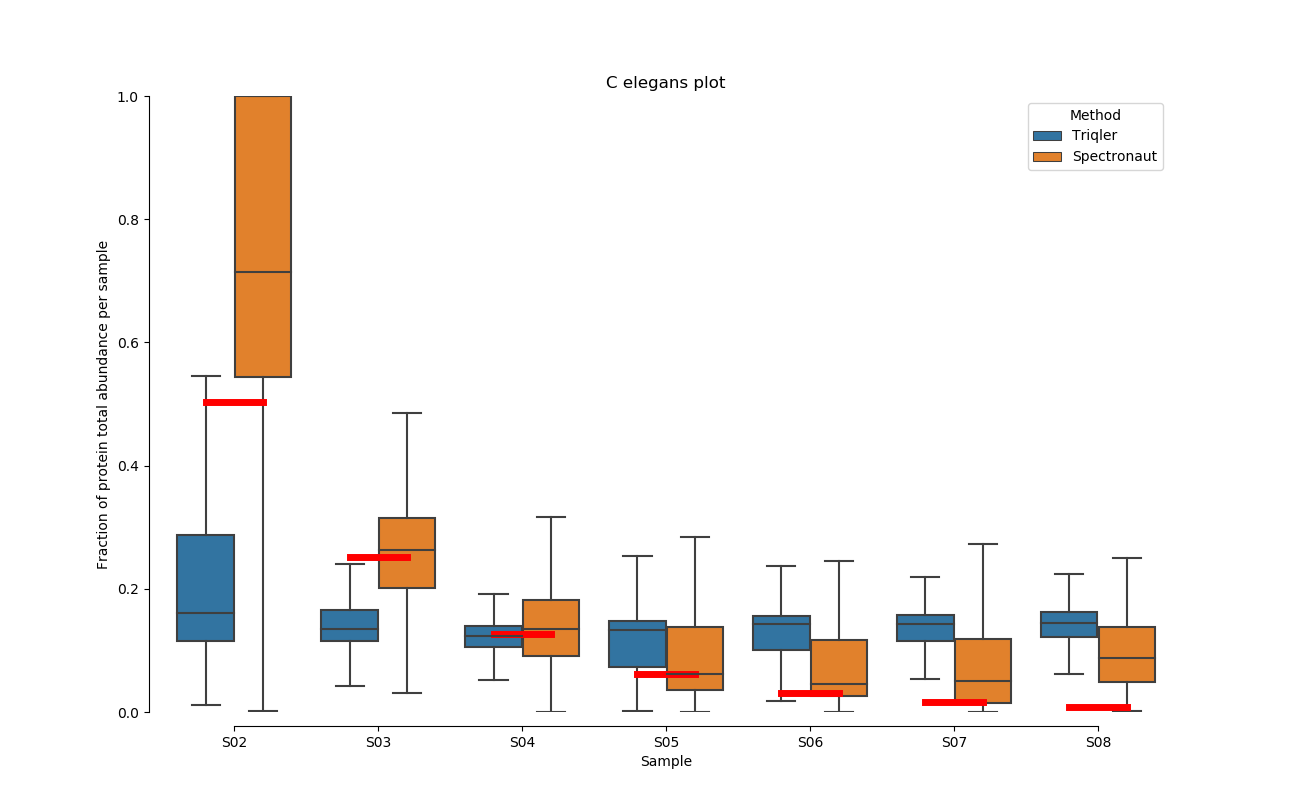
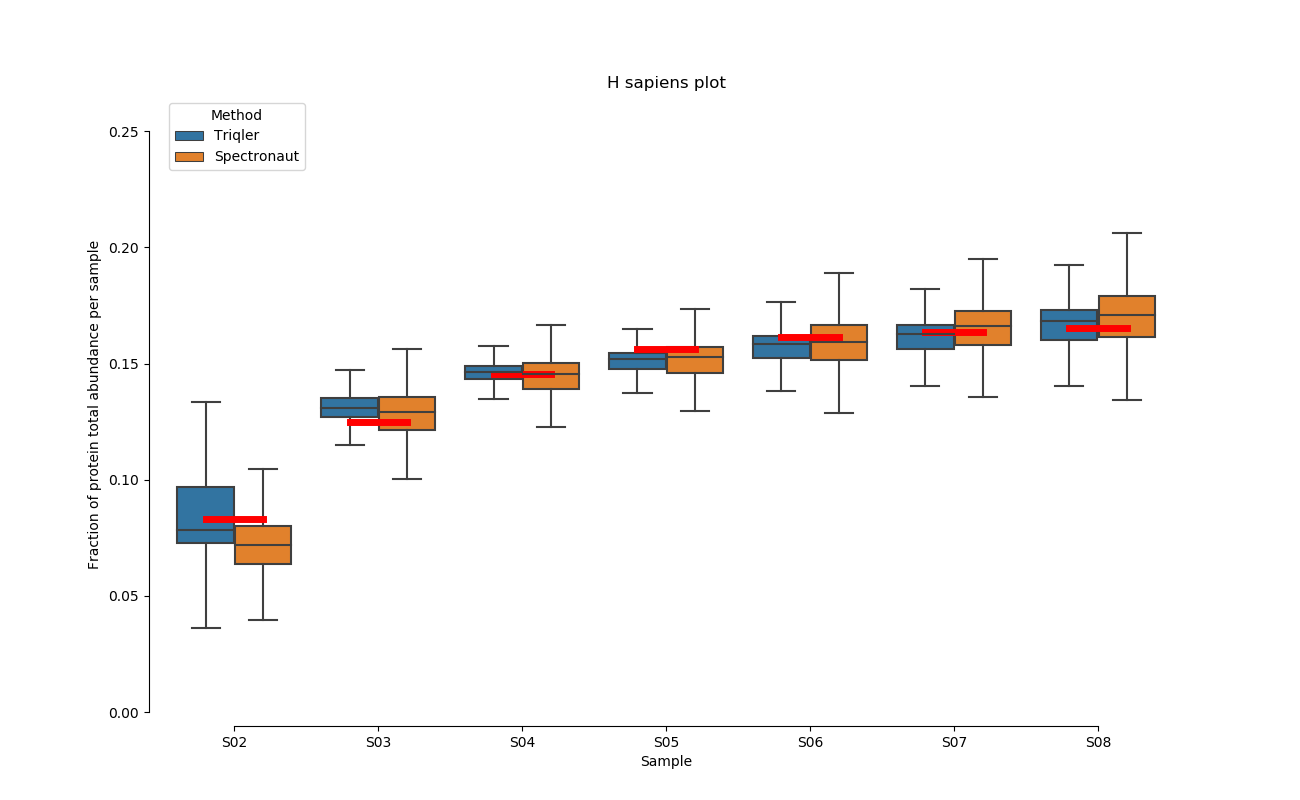
Parallell coordinates of non-adjusted intensity
Will do this on adjusted data set later…
A. Thaliana parallell coordinates
C. Elegans parallell coordinates
H. Sapiens parallell coordinates
NOTE TO SELF: still need to fix label issue for parallell coordinates.
2020-06-27 fixing the 1.0 intensity error in PSSS3 data set for triqler.
Here is a link to a short analysis of the 1.0 intensities
ToDo: if not “decoy” suffix in triqlerFormatted data: if intensity == 0 => Drop by setting the intensities to 0.0.
2020-06-26 loglog plot of p-values vs q-values of triqler results of human S02 v S06
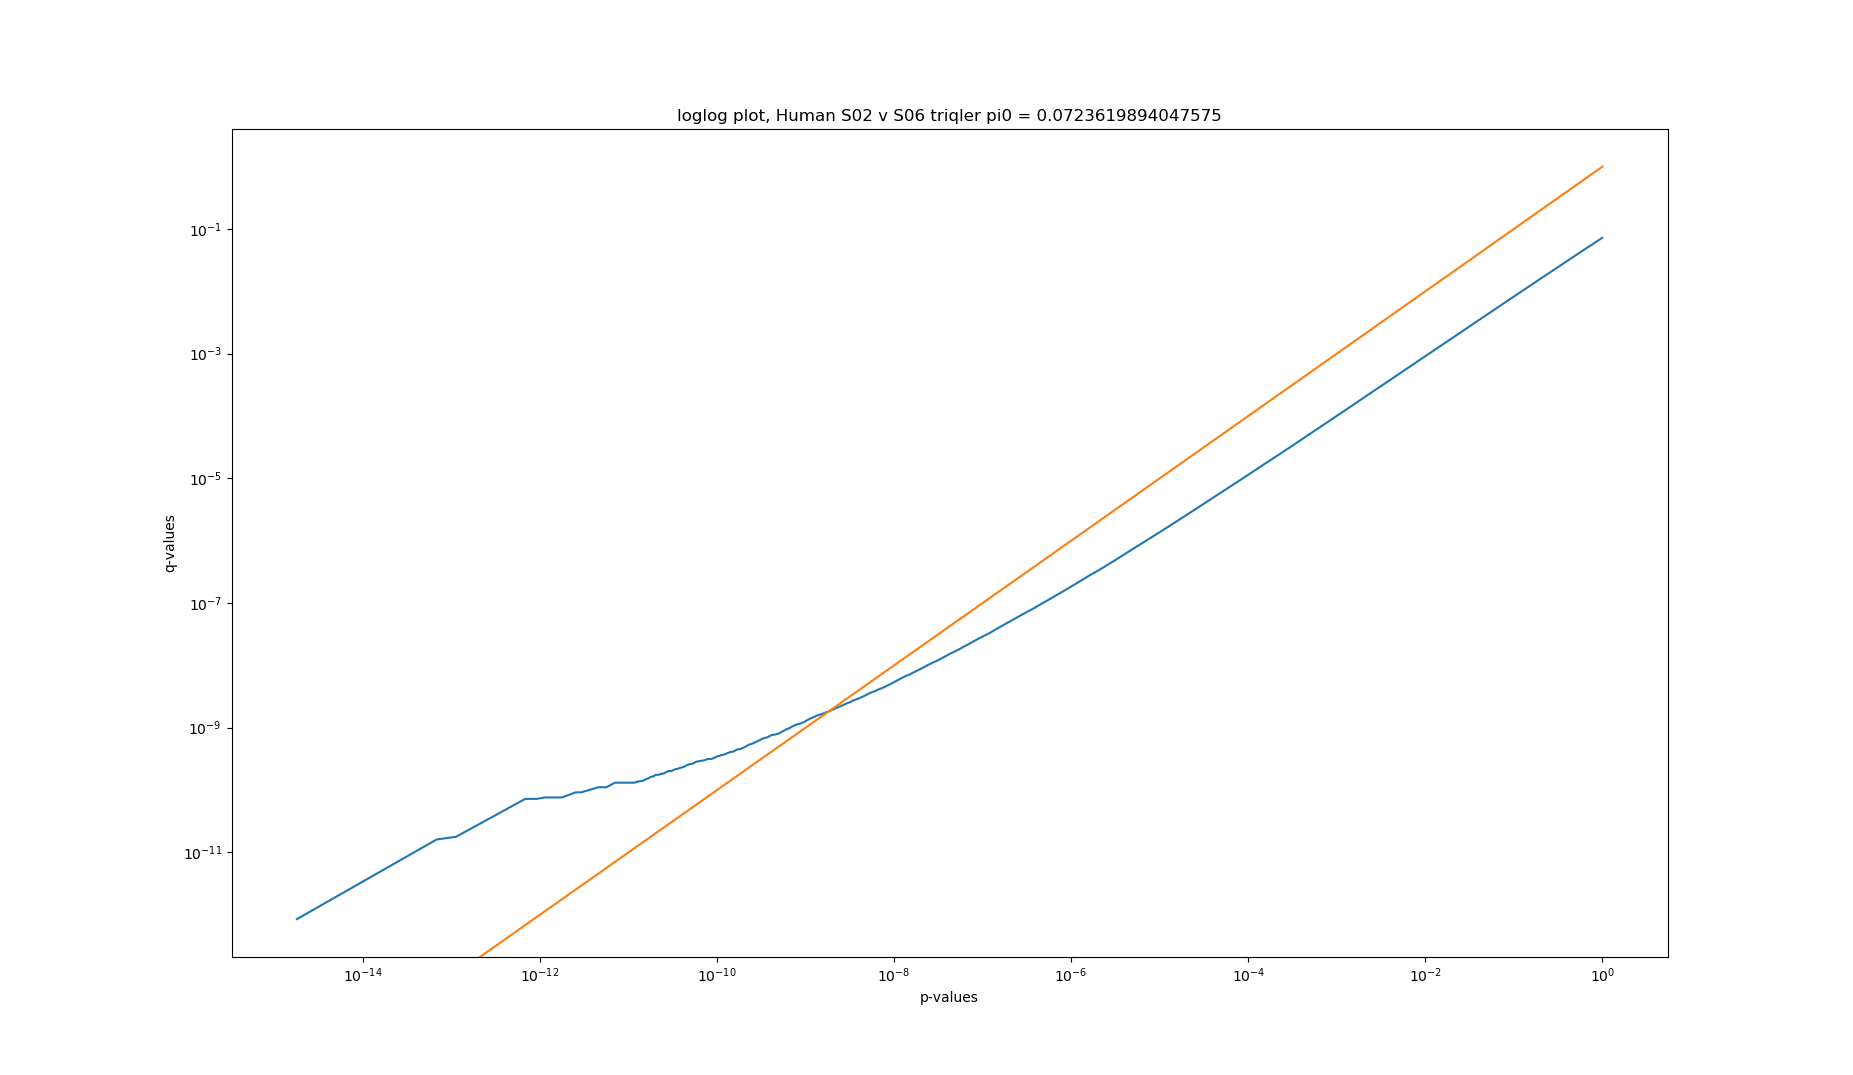
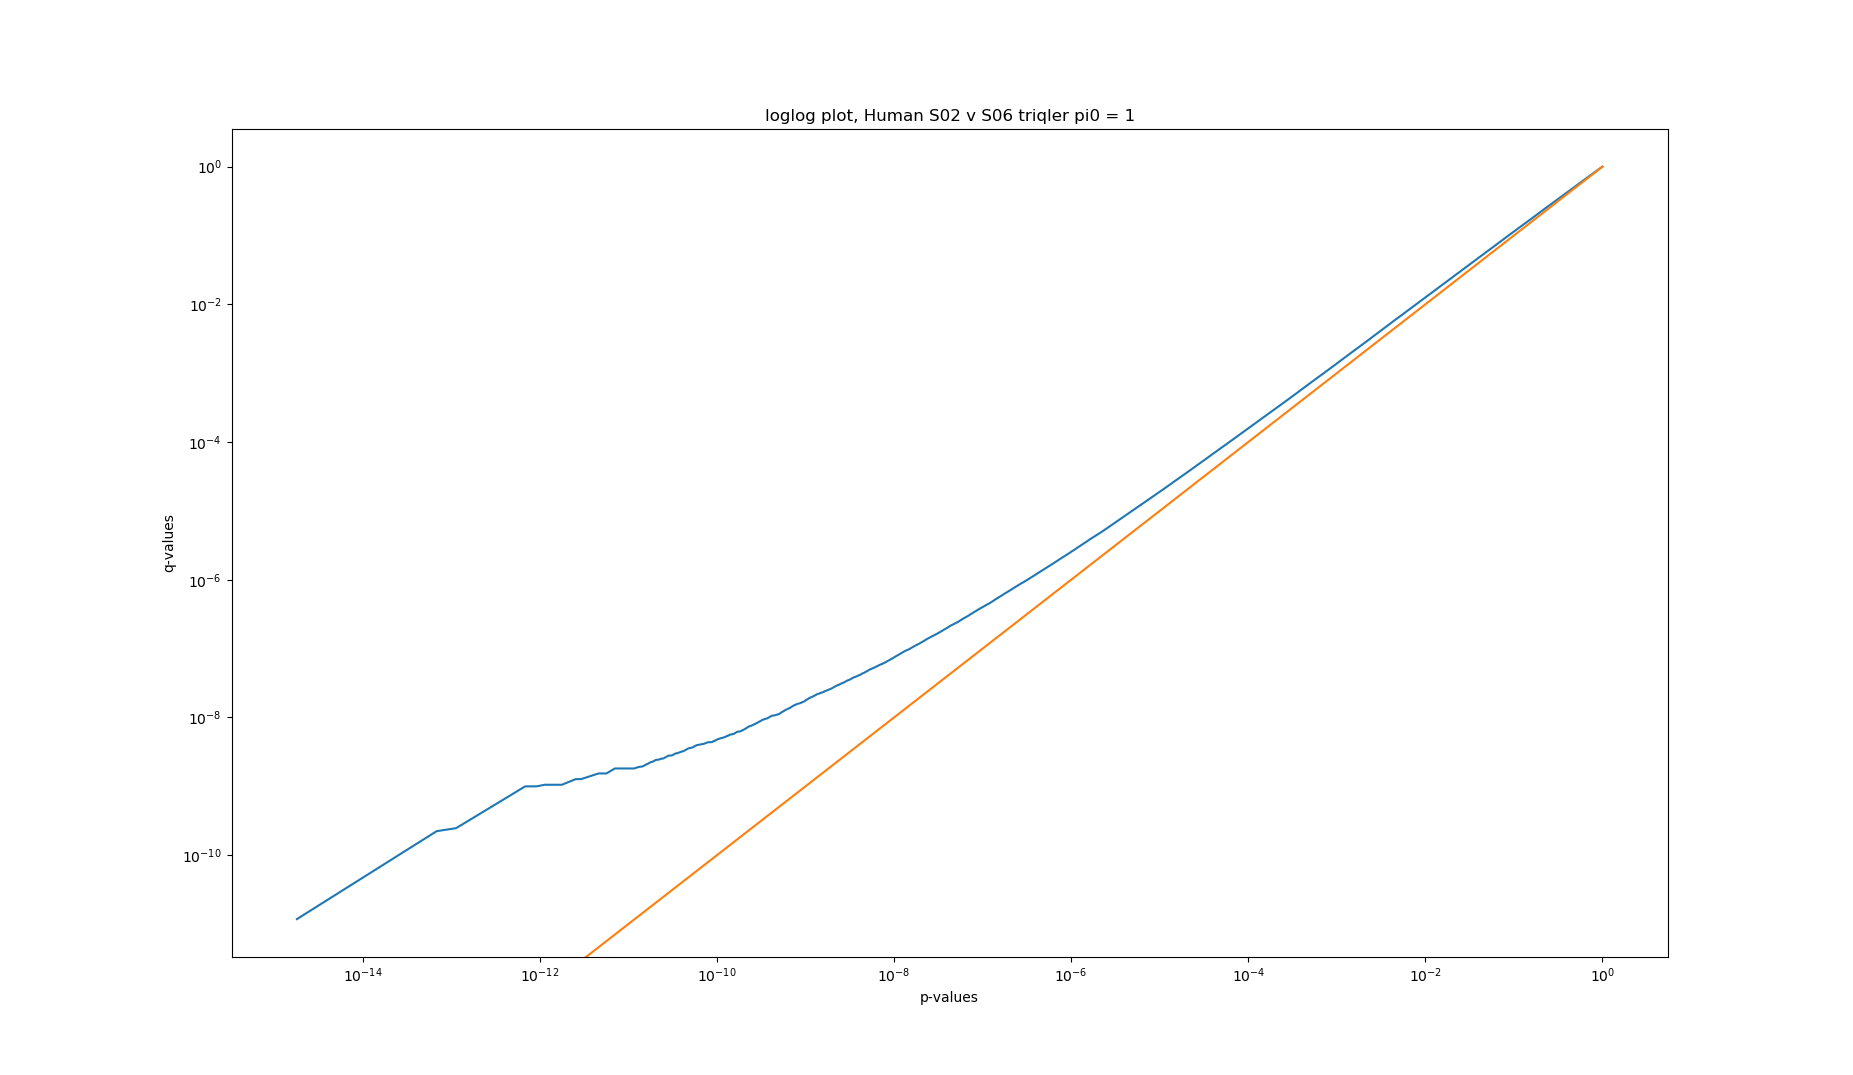
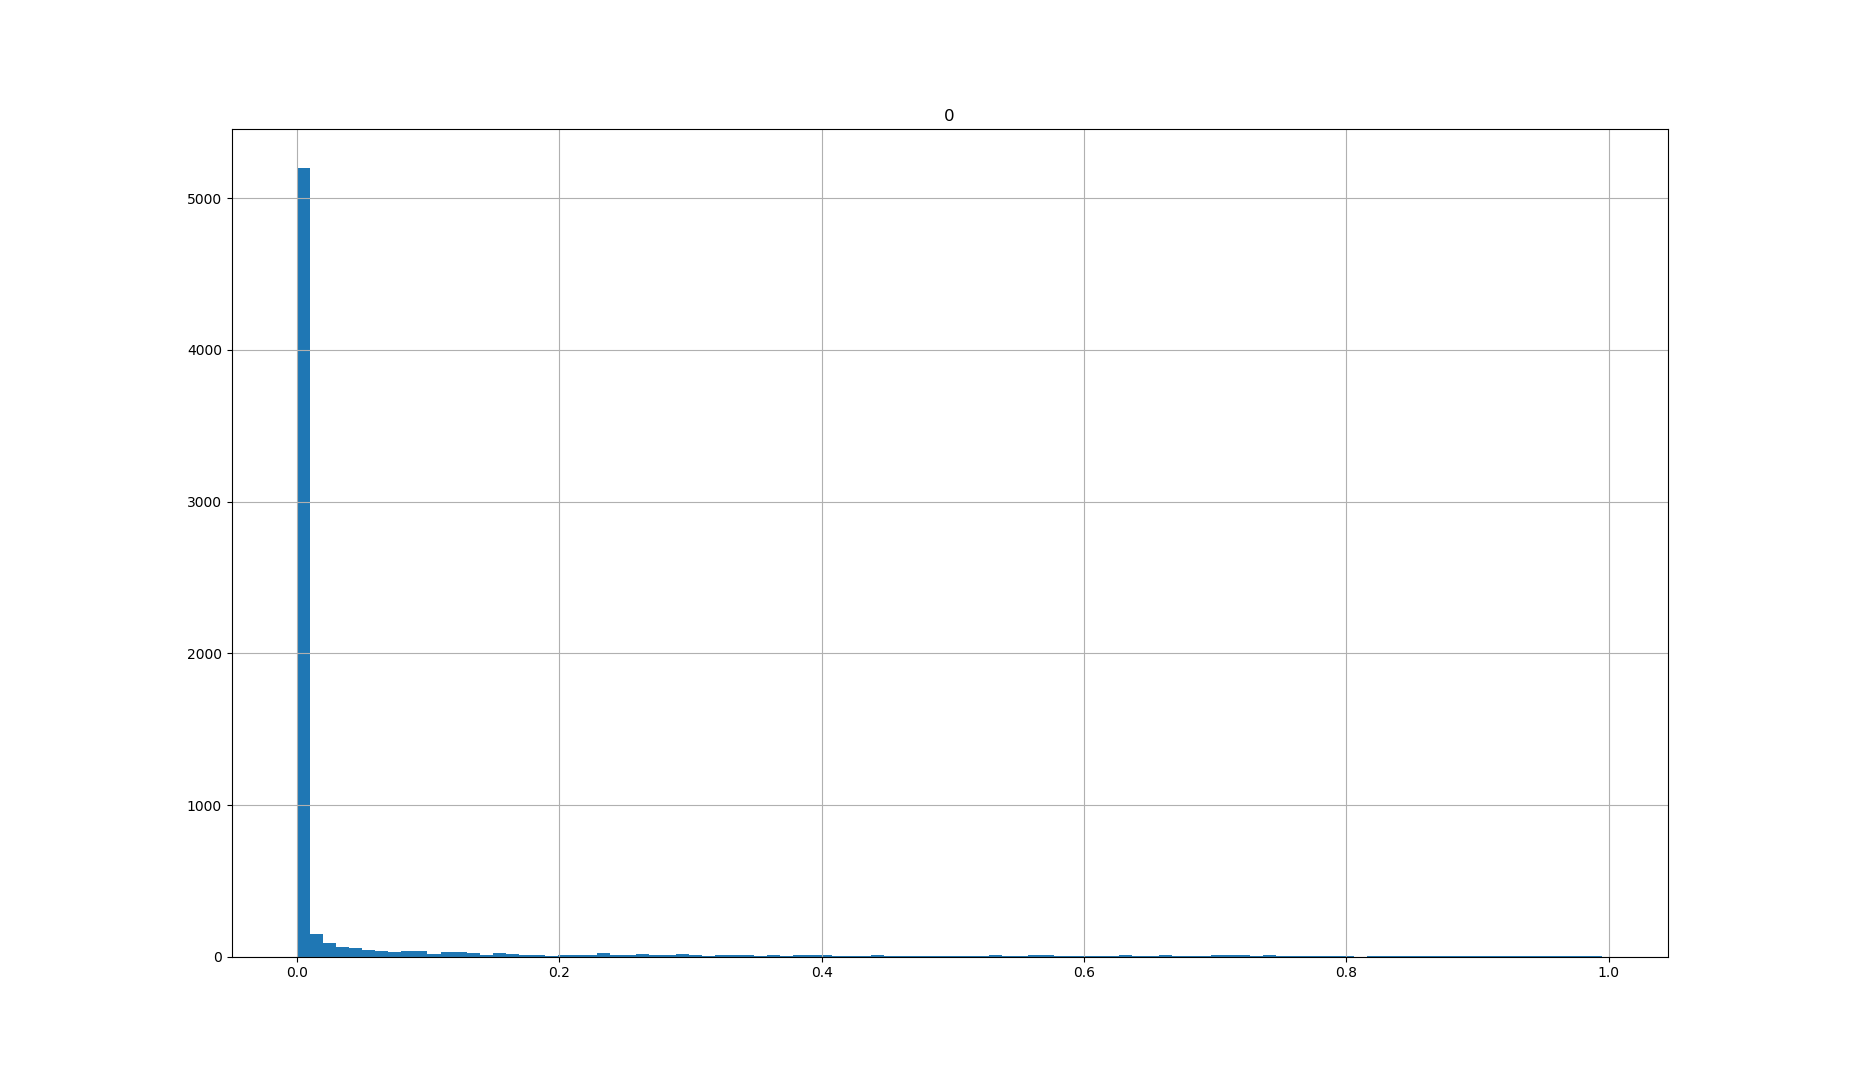
Converting p-values to q-values should usually lower the amount of significant proteins. Looking at the q-value conversion with pi0 estimates, we can see that at high p- and q-values, there are actually more significant proteins for p-values. The histogram shows that this is because the pi0 estimate is set very low (pi0 = 0.0724). Fixing the pi0 = 1 gives the expected behaviour of less significant proteins at q-value significance.
Higher pi0 gives higher q-values and are thus more conservatives and should give less significance.
These experiment can be generated using code in https://github.com/patruong/bayesProtQuant/tree/master/results/2019-06-26_loglogpq (commit 03f3714)
2020-06-20 Differential Expression
Parameters: S02 vs S06 Triqler parameters: minSamp = 15
Homo Sapiens (S02vS06)
| Spectronaut (t-test) | Triqler (t-test) | Triqler (FC_treshold = 0.1) | Triqler (FC_treshold = 1.0) | Triqler (FC_treshold = 1.2) |
|---|---|---|---|---|
| 4711 | 6350 | 5887 | 2577 | 346 |
Caenorhabditis elegans (S02vS06)
| Spectronaut (t-test) | Triqler (t-test) | Triqler (FC_treshold = 0.1) | Triqler (FC_treshold = 1.0) | Triqler (FC_treshold = 1.2) |
|---|---|---|---|---|
| 213 | 2461 | 2162 | 886 | 821 |
Arabidopsis thaliana (S02vS06)
| Spectronaut (t-test) | Triqler (t-test) | Triqler (FC_treshold = 0.1) | Triqler (FC_treshold = 1.0) | Triqler (FC_treshold = 1.2) |
|---|---|---|---|---|
| 39 | 22 | 606 | 0 | 0 |
Fixed bug in triqlerParser.py causing only half the triqler data sets to be read.
def readFile(filename):
    """
    read in filename and return header and rows of the file as lists.
    """
    f = open(filename, "r")
    f_header = f.readline().replace("\n","").split("\t")
    f_rows = []
    for i in f:
        f_row = f.readline().replace("\n","").split("\t") #python 3.6 # <---- ERROR
        f_rows.append(f_row)
    return f_header, f_rows
Should be
...
    for i in f:
        f_row = i.replace("\n","").split("\t") #python 3.6 # <---- ERROR
        f_rows.append(f_row)
...
New comparison plots below:
2019-06-19 top3 most intense peptides.
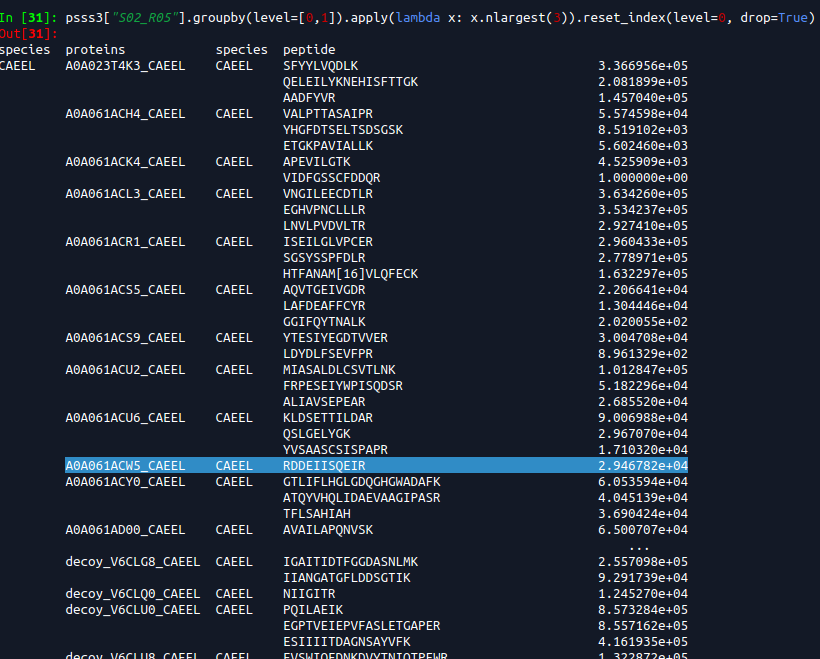
PG.Quantity is based on a mix of Top3 intense peptides and reproducibility of identification. What about cases without Top3 intense peptides? And how does it account for reproducibility of identification? I guess this should be the C-score (searchScore) in triqler output format.
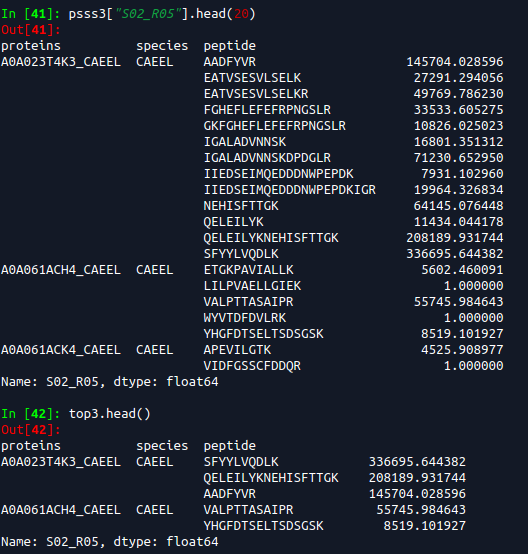
If we filter on top3 peptides then some trash, like the 1.0 values seen above gets into Triqler. I need to check the searchScore for these to see how much they impact the posteriors.

Normalized with protein intensity / sum of proteins intensities. Just taking top 3 intensities does not give a good match at all. This confirms that we are sending a lot of trash into triqler. I am still uncertain if triqler searchScore someone manages to adjust this properly.
2019-06-18 comparison with default settings.
Plotted using:
foo@bar:~$ python main.py comparisonPlot --PSSS3_input "../data/500-PSSS3-raw-reformatted_dropna_dropdup_decoy_nonShared_again.csv" --triqler_input "../data/triqler_output_old/proteins.1vs2.tsv" --fdr_treshold 0.05 --outputSuffix TEST